
Why Did Performance Drop Before the National TT Championship?
A RedPlus case study: TrainingPeaks, blood markers, red blood cell timing and an unexplained performance gap
-TrainingPeaks suggested the athlete should be fresher.
-The power data showed capacity was falling.
-The RedPlus timeline gave the missing explanation: timing.
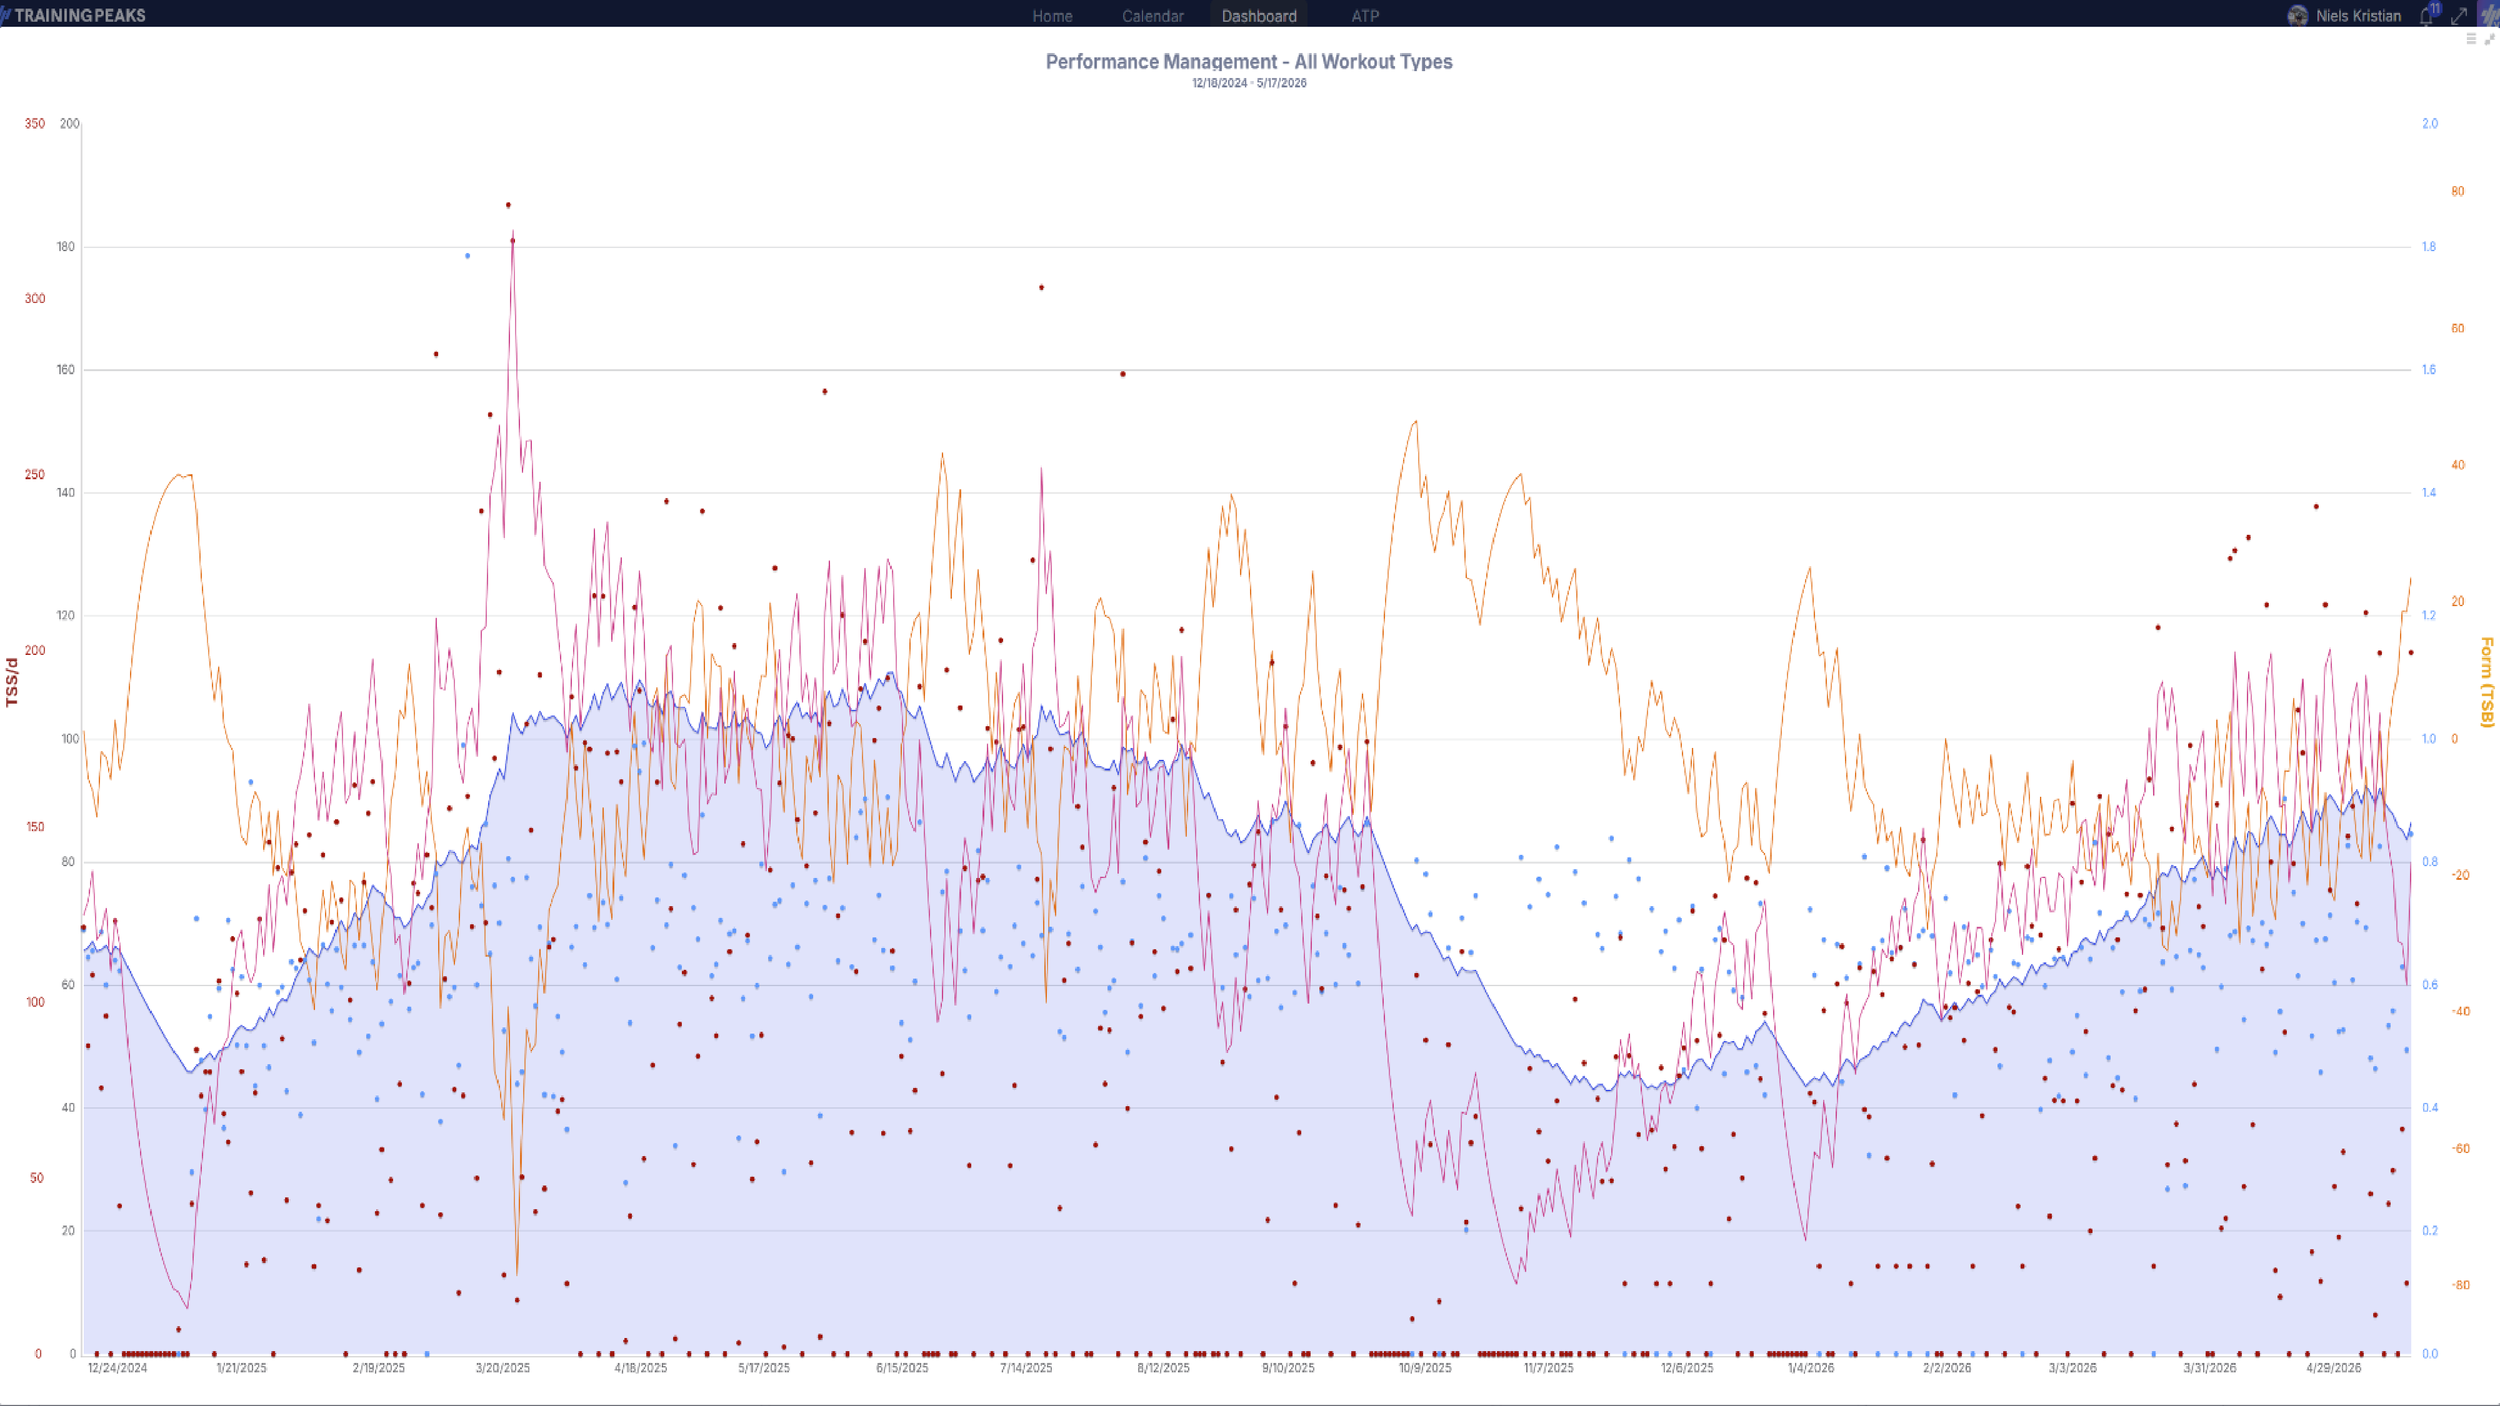
This case study follows former Pro Rider, now Master 50 Rider Niels Kristian Andersen across a 21.5-week period from 18 December 2024 to 17 May 2025, combining TrainingPeaks data, RedPlus hypoxic stimulus data, blood tests, interval power and race-specific preparation.
The central observation started with the TrainingPeaks profile.
Before looking at blood markers or RedPlus stimulus data, the TrainingPeaks chart already appeared unusual. However, the chart should not be interpreted from visual markers alone. The stronger evidence comes from documented interval-power data, Peak Power data, blood markers and RedPlus stimulus timing.
In standard TrainingPeaks interpretation, peak performance is normally expected when fatigue is reduced and form approaches neutral or positive values. In this case, however, Niels produced several strong training performances while still carrying measurable fatigue.
TrainingPeaks metrics such as CTL, ATL and TSB are based on external training load. They do not account for hypoxic breath-hold stress, oxygen-transport adaptation, red blood cell dynamics or total blood volume changes. Deep hypoxic sessions, especially those reaching low SpO₂ levels, create physiological stress that is not included in the TrainingPeaks model. As a result, the athlete’s true physiological load may have been underestimated, while important adaptation signals were invisible in the standard chart.
In other words, the TrainingPeaks profile raised the question — but the power data, blood markers and RedPlus timeline made the case stronger.
Peak Power data added a stronger performance reference
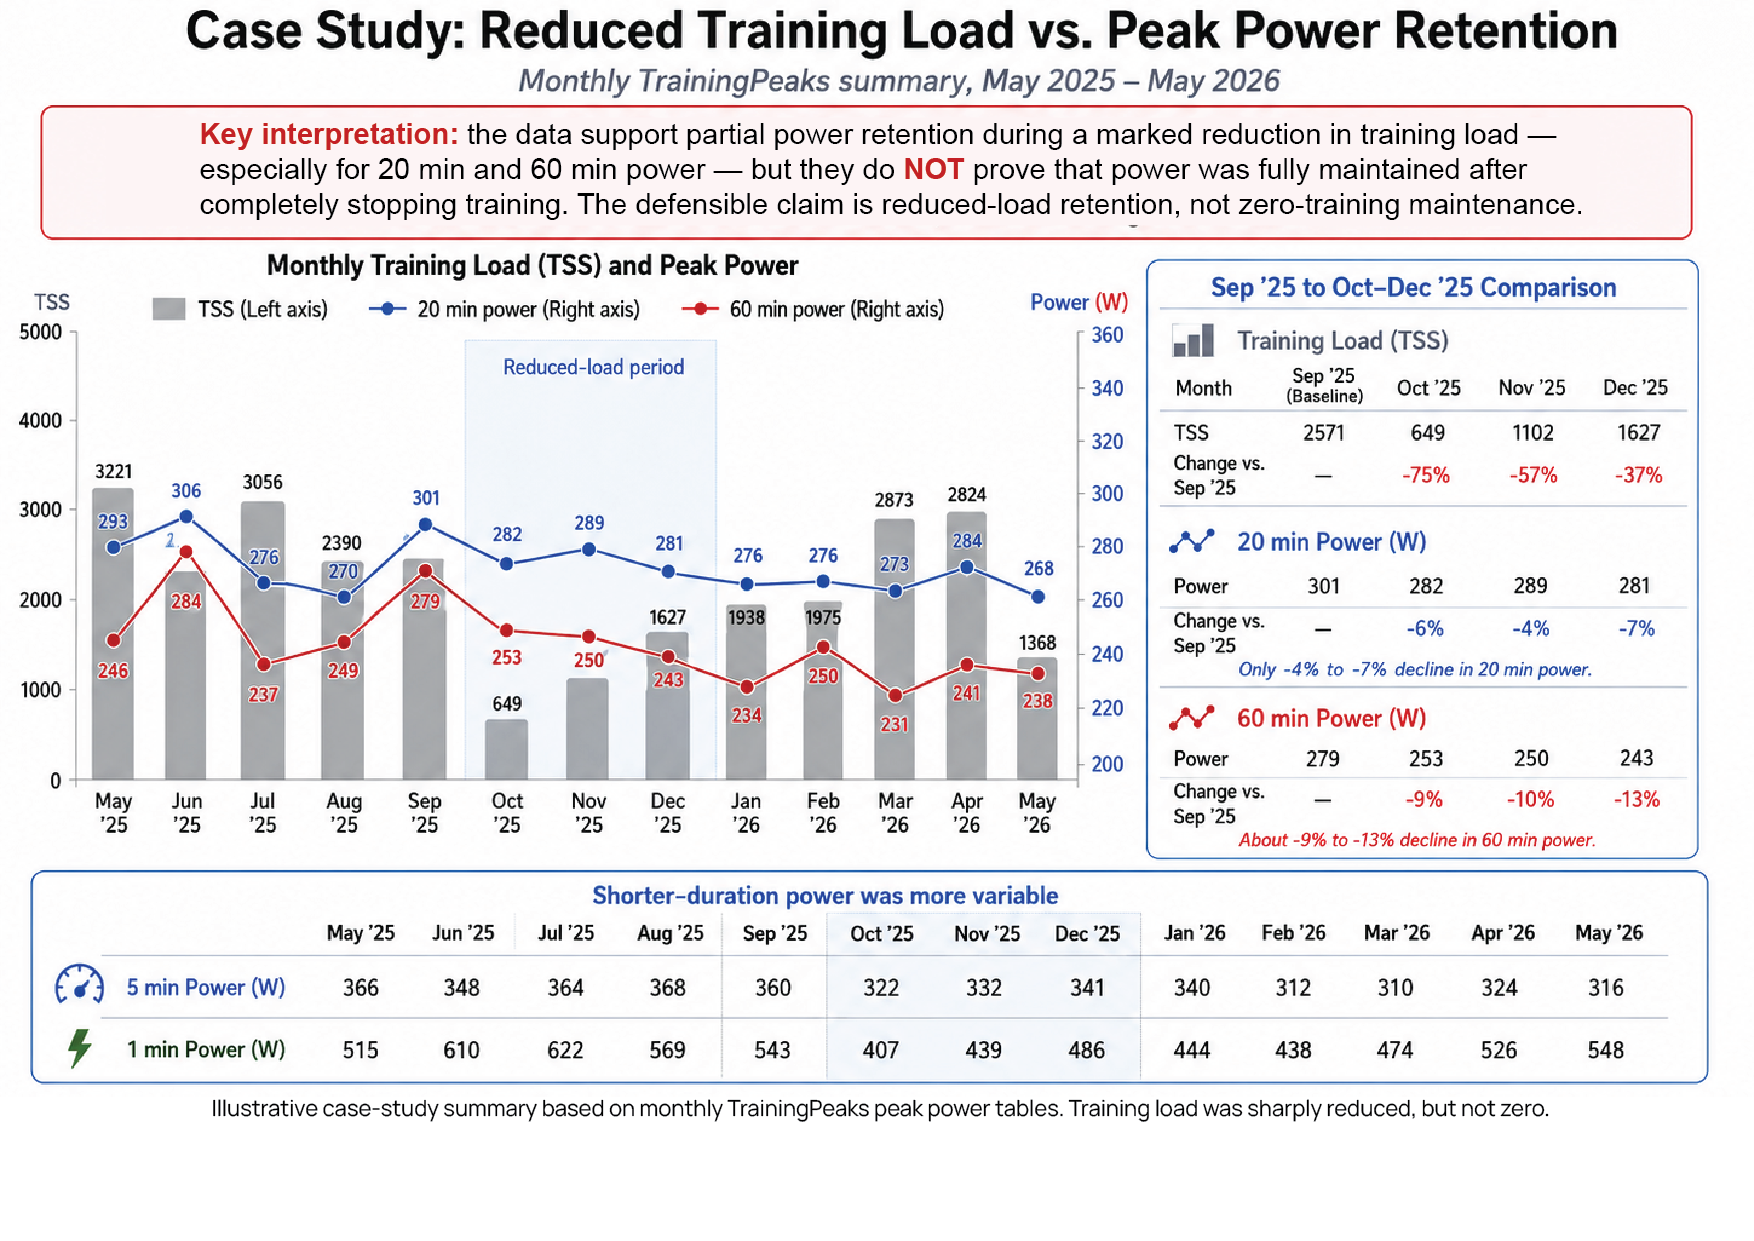
The broader TrainingPeaks chart was useful as a visual starting point, but the stronger performance reference came from TrainingPeaks Peak Power data.
Later review showed that peak-power metrics, especially longer-duration power, remained relatively preserved during a period of sharply reduced training load.
From September 2025 to December 2025, monthly TSS dropped from 2571 to 1627, a reduction of approximately 37%.
During the same period:
20-minute peak power declined from 301 W to 281 W, approximately 7%
60-minute peak power declined from 279 W to 243 W, approximately 13%
This does not prove that performance was fully maintained, and it should not be interpreted as a zero-training maintenance effect. The more defensible interpretation is that longer-duration power showed unusual resilience relative to the reduction in training load.
This supports the broader case: the TrainingPeaks chart raised the question, but the interval-power data, Peak Power data, blood markers and RedPlus stimulus timing carry the stronger argument.
The unexplained problem before the National TT Championship
One specific moment in the season remained difficult to explain at the time: the performance drop before the Danish National TT Championship.
The preparation had been planned carefully. Training load, freshness and race timing had all been managed with the intention of arriving at the TT in good condition. On paper, the athlete should have been ready to perform.
TrainingPeaks supported that expectation. In the period leading into the TT, form had improved and fatigue was lower.
3 May 2025: Form +20
10 May 2025: Form +9
17 May 2025: Form +9
So the athlete should have been fresh.
But the power data told a different story.
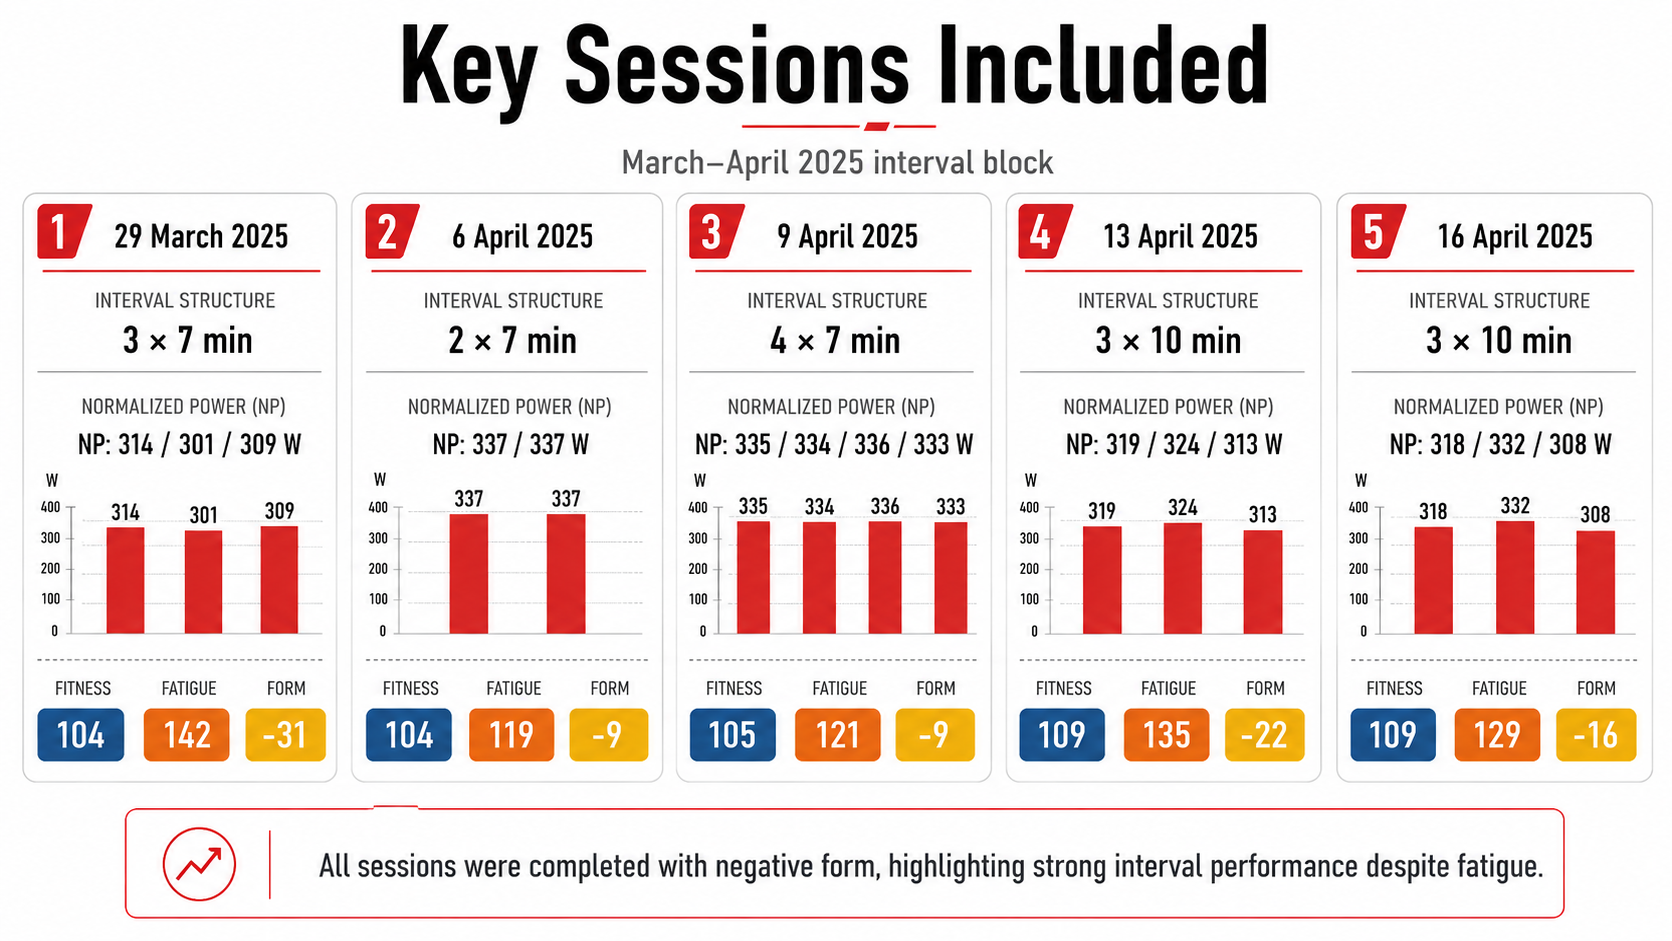
In late March and April, Niels produced several strong interval sessions. These included repeated 7-minute and 10-minute efforts around or above his normal threshold range, which was approximately 311–315 W.
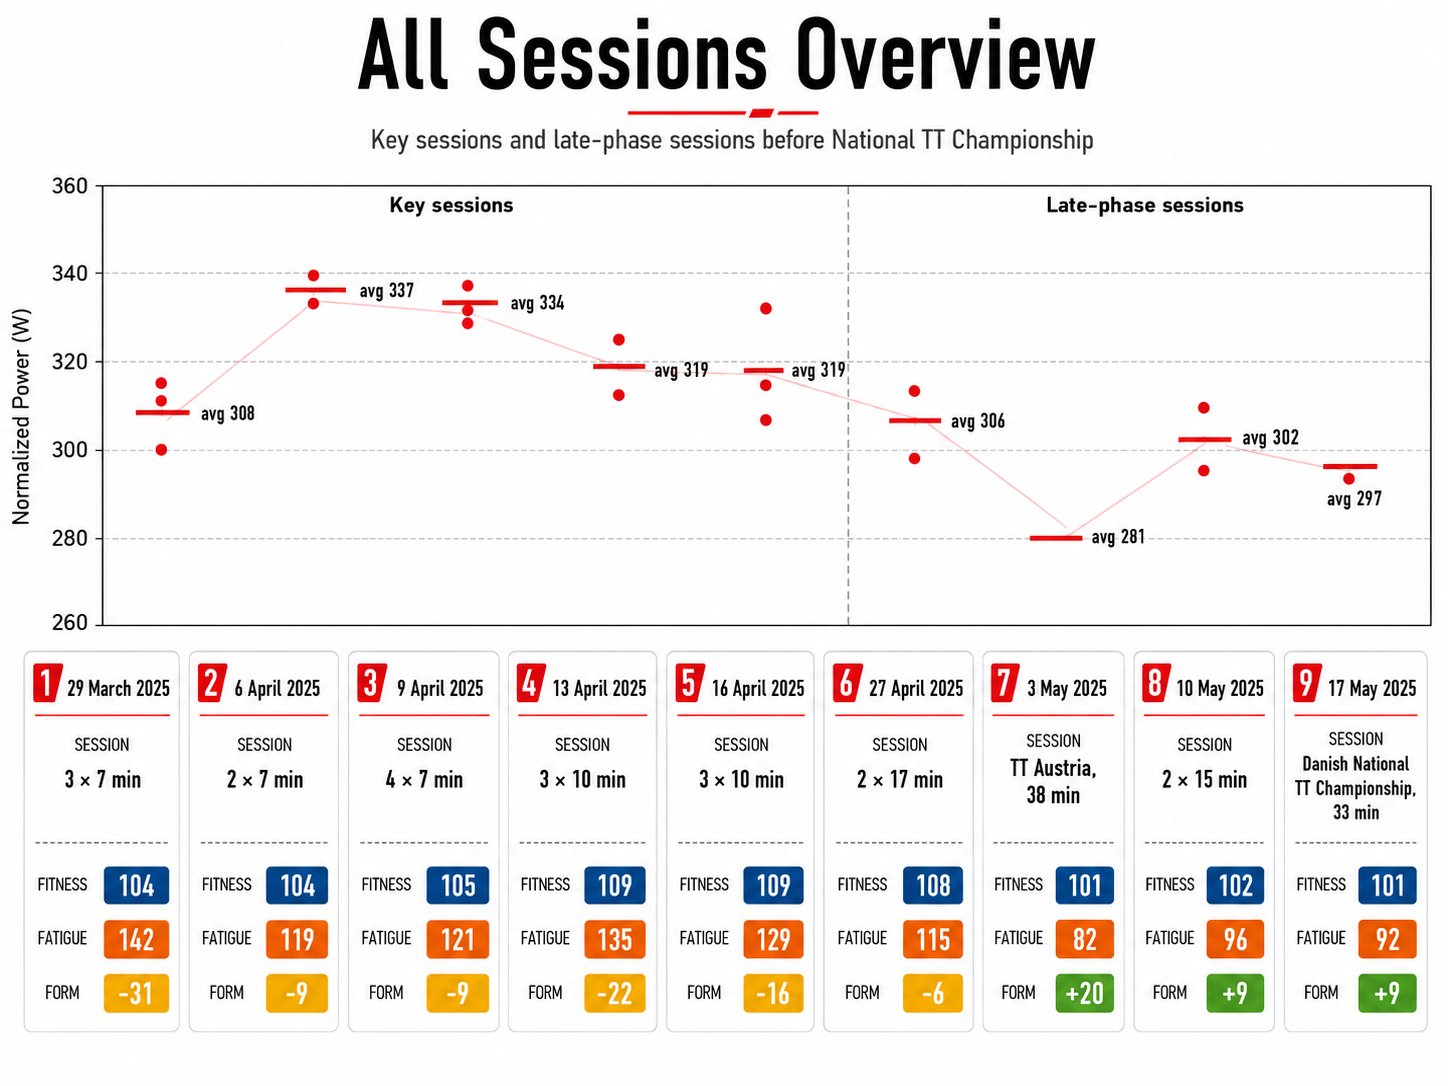
Key sessions included:
29 March 2025: 3 × 7 min — NP 314 / 301 / 309 W
Fitness 104, Fatigue 142, Form -316 April 2025: 2 × 7 min — NP 337 / 337 W
Fitness 104, Fatigue 119, Form -99 April 2025: 4 × 7 min — NP 335 / 334 / 336 / 333 W
Fitness 105, Fatigue 121, Form -913 April 2025: 3 × 10 min — NP 319 / 324 / 313 W
Fitness 109, Fatigue 135, Form -2216 April 2025: 3 × 10 min — NP 318 / 332 / 308 W
Fitness 109, Fatigue 129, Form -16
These were not soft endurance rides. These were strong threshold and supra-threshold interval performances, several of them produced while TrainingPeaks form was still clearly negative.
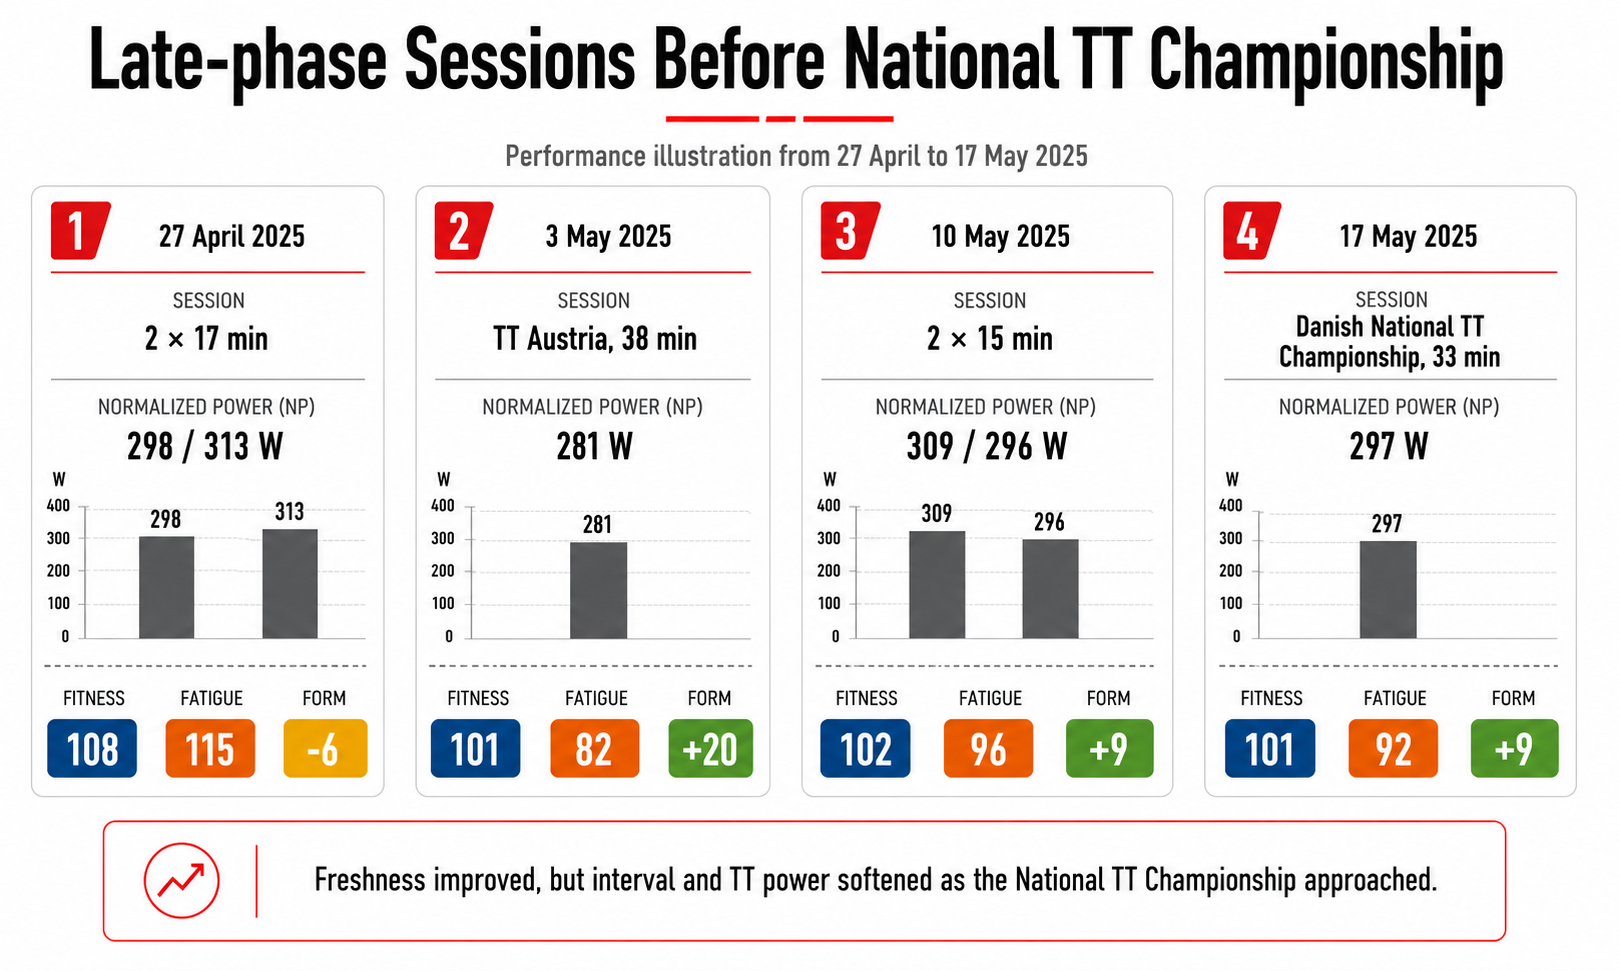
Then, as the National TT Championship approached, the numbers softened:
27 April 2025: 2 × 17 min — NP 298 / 313 W
Fitness 108, Fatigue 115, Form -63 May 2025: TT Austria, 38 min — NP 281 W
Fitness 101, Fatigue 82, Form +2010 May 2025: 2 × 15 min — NP 309 / 296 W
Fitness 102, Fatigue 96, Form +917 May 2025: Danish National TT Championship, 33 min — NP 297 W
Fitness 101, Fatigue 92, Form +9
This created a contradiction.
The athlete was fresher according to TrainingPeaks, but power output had declined compared with the stronger April interval block. That made the drop difficult to explain as a simple fatigue problem.
The athlete was not carrying extreme fatigue. The taper had been planned. Form was positive. Yet the power data moved the wrong way.
At the time, there was no clear explanation.
The missing piece appeared after the season
The explanation only became visible later, after the season had ended and the RedPlus data, blood tests and TrainingPeaks data were reviewed together.
Niels had started testing the RedPlus protocol on 18 December 2024. At the time, this was not planned specifically around the Danish National TT Championship. The protocol was being tested to understand the physiological response to repeated empty-lung hypoxic breath-holds and to evaluate whether the RedPlus method could produce measurable adaptation.
The blood data showed a clear response during the winter build phase.
On 21 January 2025, after the first major stimulus phase, the cumulative RedPlus stimulus was approximately 1677.
By the second blood test on 26 February 2025, the cumulative stimulus had increased to approximately 3599.
The blood markers changed strongly during this period:
Hemoglobin increased from 14.2 to 15.5 g/dL
Hematocrit increased from 42.5% to 46.9%
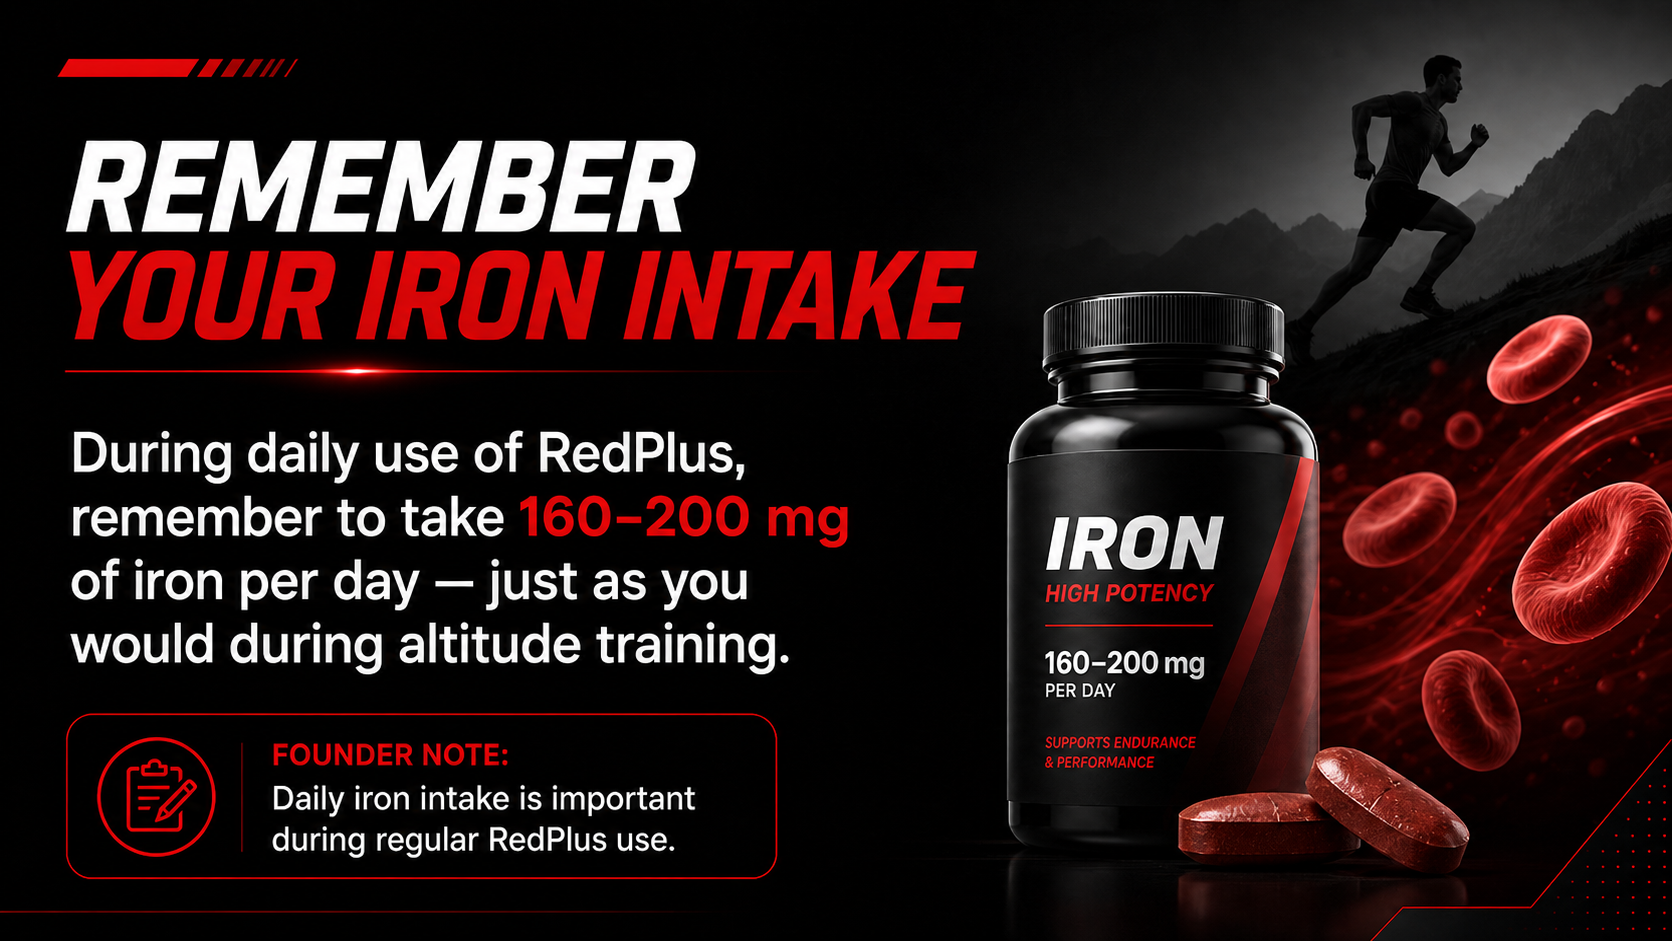
Ferritin dropped from 368.6 to 202.9
Serum iron decreased from 12.3 to 10.5
This pattern is physiologically consistent with increased erythropoietic activity and iron utilization during the high-stimulus phase.
The peak blood test was therefore:
26 February 2025 — HCT 46.9%
At the time, that peak was not linked to the later TT performance issue.
But when the weeks were counted forward after the season, the timing became highly relevant.
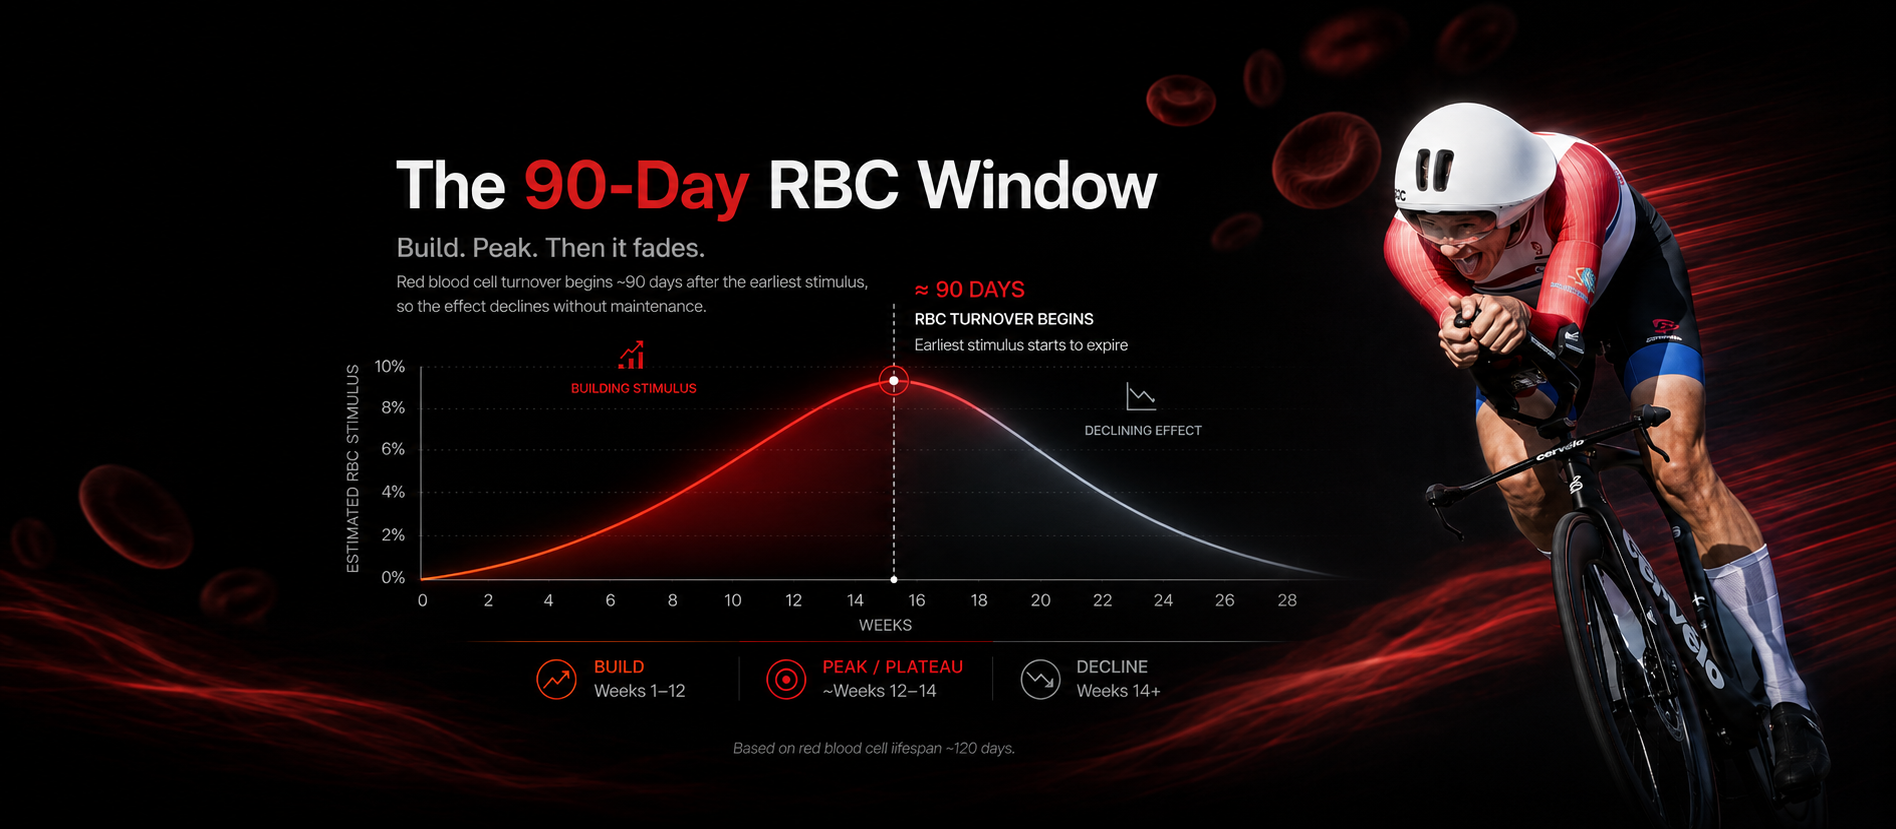
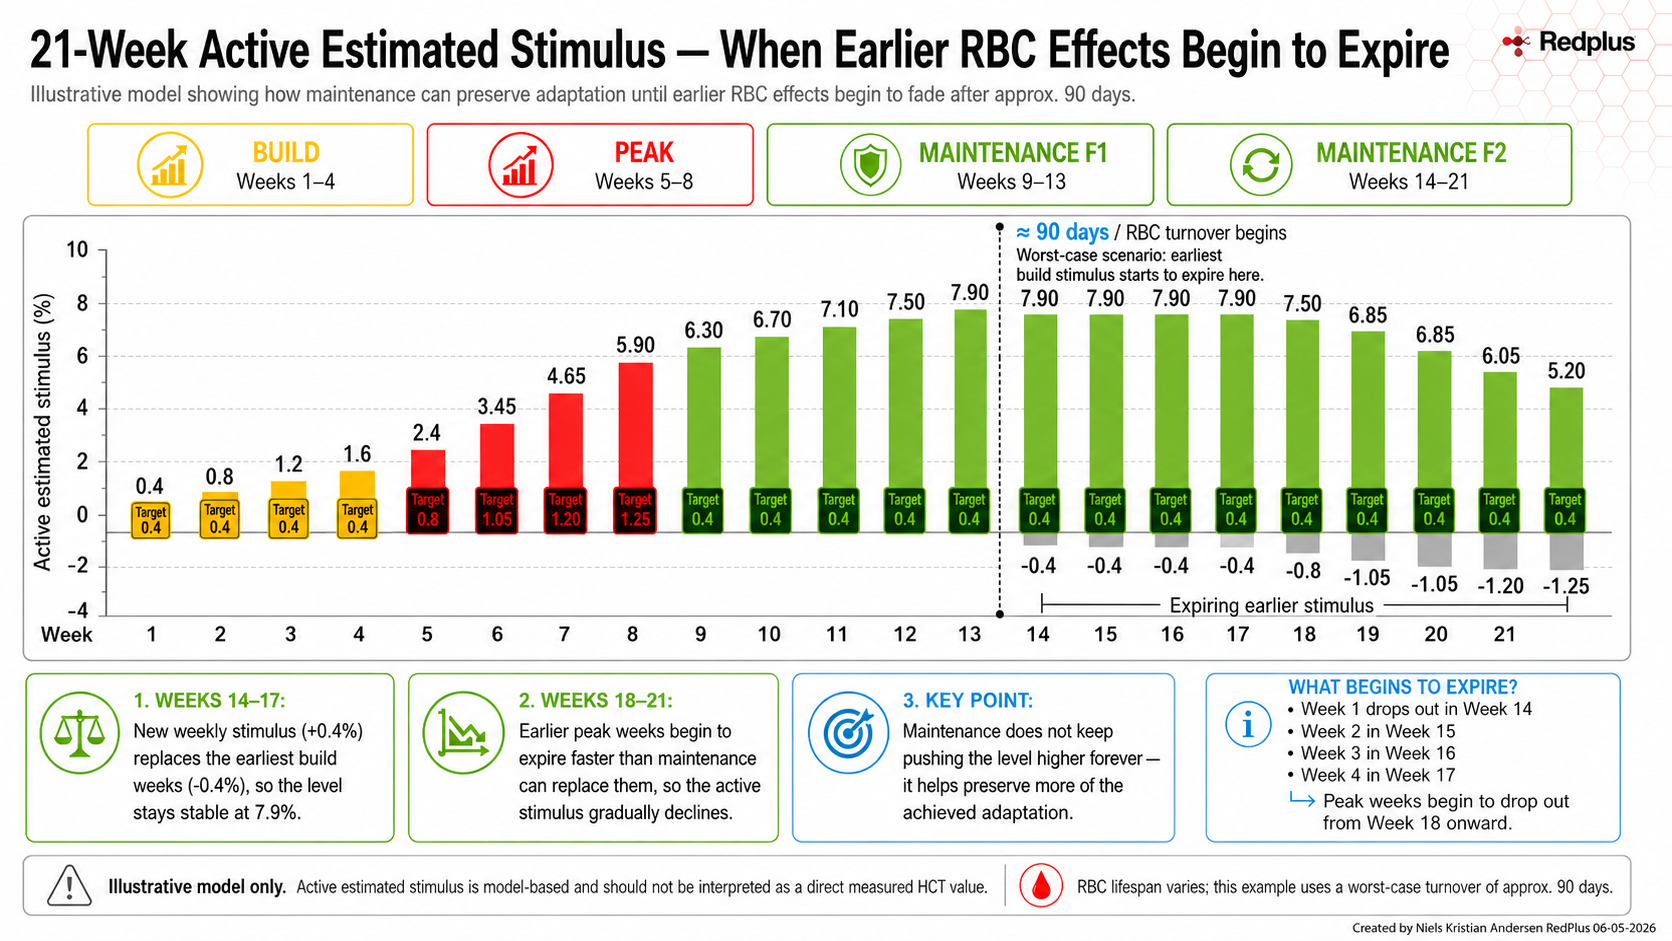
From 18 December 2024 to 17 May 2025 is approximately 21.5 weeks. The main RedPlus build phase ran from 18 December to the hematocrit peak on 26 February. The Danish National TT Championship then arrived during the later biological window where red blood cells produced early in the build phase would be expected to approach turnover.
That is the missing piece.
The performance drop before the National TT Championship was not obvious during the season. It only became clear afterwards that the timing of the decline aligned with the expected lifespan and turnover window of red blood cells generated during the earlier RedPlus build phase.
Why this strengthens the case
This does not prove causation. It is still a single-athlete observational case.
But it strengthens the case because multiple signals point in the same direction.
The TrainingPeaks profile appeared atypical, but it should not be interpreted from the chart alone. The stronger support comes from documented interval-power data, later Peak Power data, blood markers and RedPlus stimulus timing.
The broader pattern can be summarized like this:
High RedPlus stimulus
Clear blood marker response
Strong interval performance under negative form
Lower power despite improved freshness before the National TT Championship
Timing alignment with expected red blood cell turnover
Later Peak Power resilience during sharply reduced training load
The key point is not that one TT result proves anything.
The key point is that the TT performance drop fits into a larger pattern. Niels produced very strong interval performances under fatigue in March and April, then showed lower power despite improved freshness before the Danish National TT Championship.
Later, longer-duration Peak Power metrics remained relatively preserved during a period of sharply reduced training load, which supports a retention/resilience interpretation.
This does not prove causation, but it makes the timing and physiological interpretation difficult to ignore.

Interpretation
The National TT Championship became an important retrospective signal.
At the time, the performance drop was difficult to explain because the athlete was not unusually fatigued. TrainingPeaks form was positive, and the taper should have supported performance. However, the interval and TT power data showed that capacity had softened compared with the stronger April block.
Only after reviewing the RedPlus timeline did the likely explanation appear: the athlete had unintentionally timed his strongest RedPlus build phase too early relative to the National TT Championship.
The hematocrit peak occurred on 26 February. By mid-May, the athlete was approaching the window where red blood cells produced during the early build phase would begin to turn over. This may explain why performance began to decline despite improved freshness.
This makes the case stronger because it adds a timing-based biological explanation to an otherwise unexplained performance gap.
The case therefore supports a practical RedPlus lesson:
The build phase matters, but timing and maintenance matter too.
If the goal is to peak for a specific event, the RedPlus stimulus must be planned with the adaptation window in mind. A strong response too early may still produce benefits, but part of that response may begin to fade before the target event if the stimulus is not maintained or timed correctly.
Case conclusion
The TrainingPeaks chart raised the original question, but the stronger evidence came from the documented power data.
Niels produced strong interval performances under negative form in March and April. Then, before the Danish National TT Championship, power output declined despite improved freshness. Later Peak Power data also showed that longer-duration power remained relatively preserved during a period of sharply reduced training load.
The later review of blood data and RedPlus stimulus timing added another layer: the unexplained performance drop before the Danish National TT Championship aligned with the expected turnover window of red blood cells produced during the winter build phase.
This does not prove causation.
But it does create a strong single-athlete signal.
The case suggests that RedPlus may influence performance through a build-maintain-decline pattern linked to oxygen-transport adaptation. It also shows why timing matters: if the stimulus is not maintained or aligned with the target event, performance may begin to fade even when classical TrainingPeaks freshness looks favorable.
The missing piece was not fatigue. The missing piece was timing.