App Guide
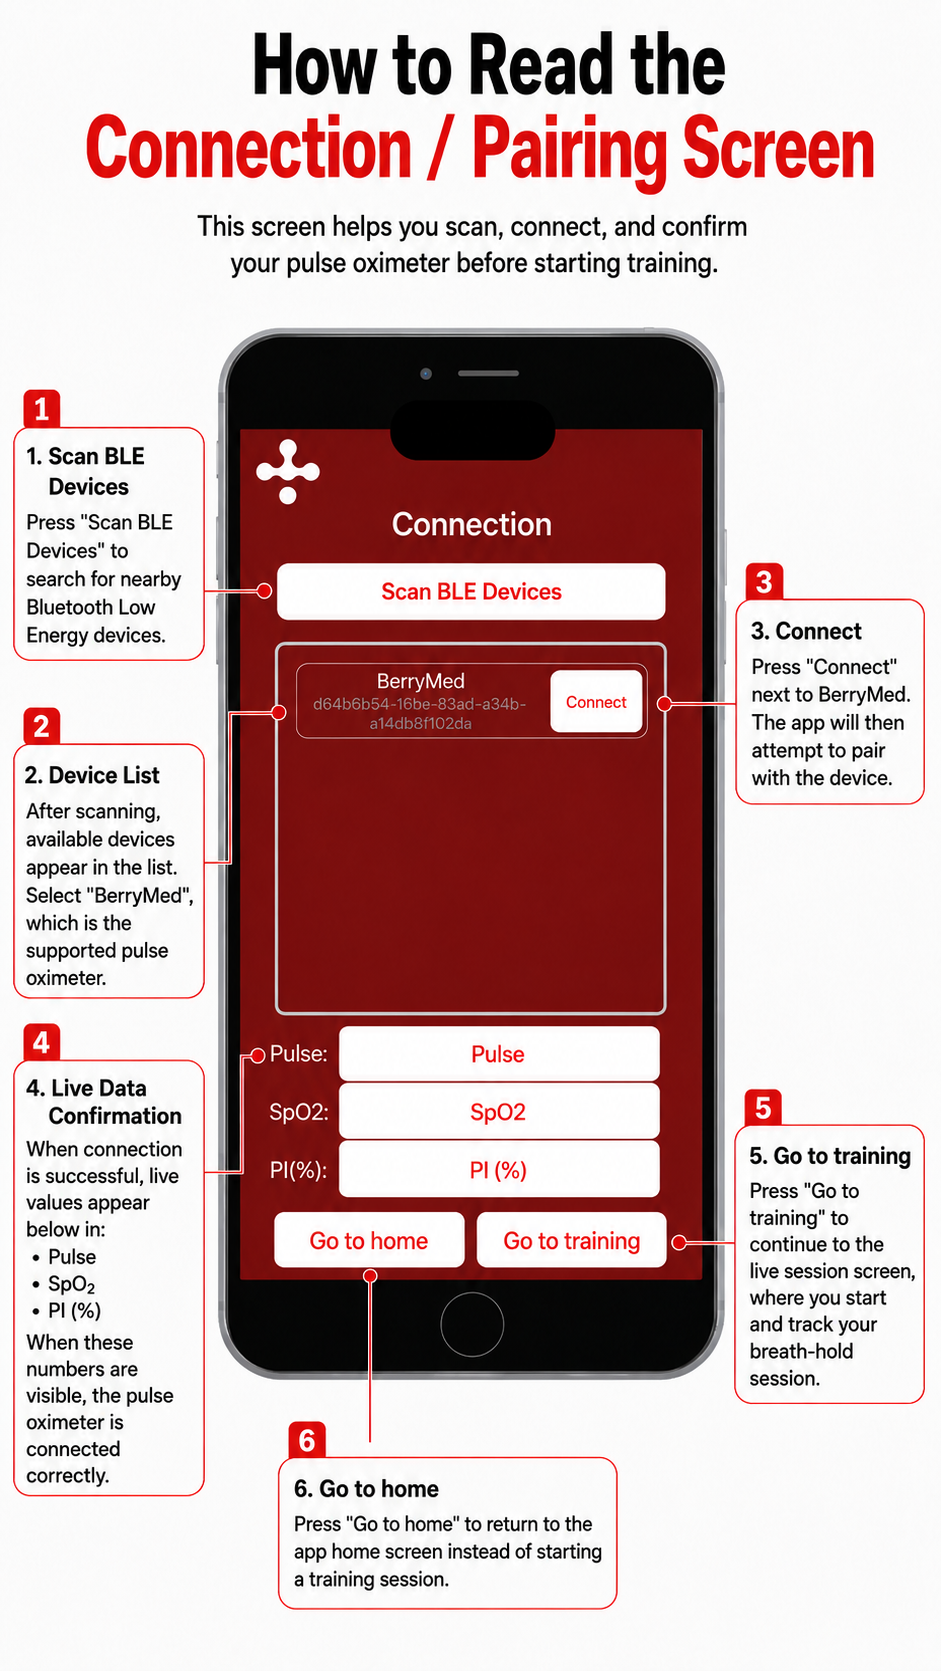
How to Read the Connection / Pairing Screen
1. Scan BLE Devices
Press “Scan BLE Devices” to search for nearby Bluetooth Low Energy devices.
2. Device List
After scanning, available devices appear in the list.
Select “BerryMed”, which is the supported pulse oximeter.
3. Connect
Press “Connect” next to BerryMed.
The app will then attempt to pair with the device.
4. Live Data Confirmation
When connection is successful, live values appear below in:
Pulse
SpO₂
PI (%)
When these numbers are visible, the pulse oximeter is connected correctly.
5. Go to Training
Press “Go to training” to continue to the live session screen, where you start and track your breath-hold session.
6. Go to Home
Press “Go to home” to return to the app home screen instead of starting a training session.
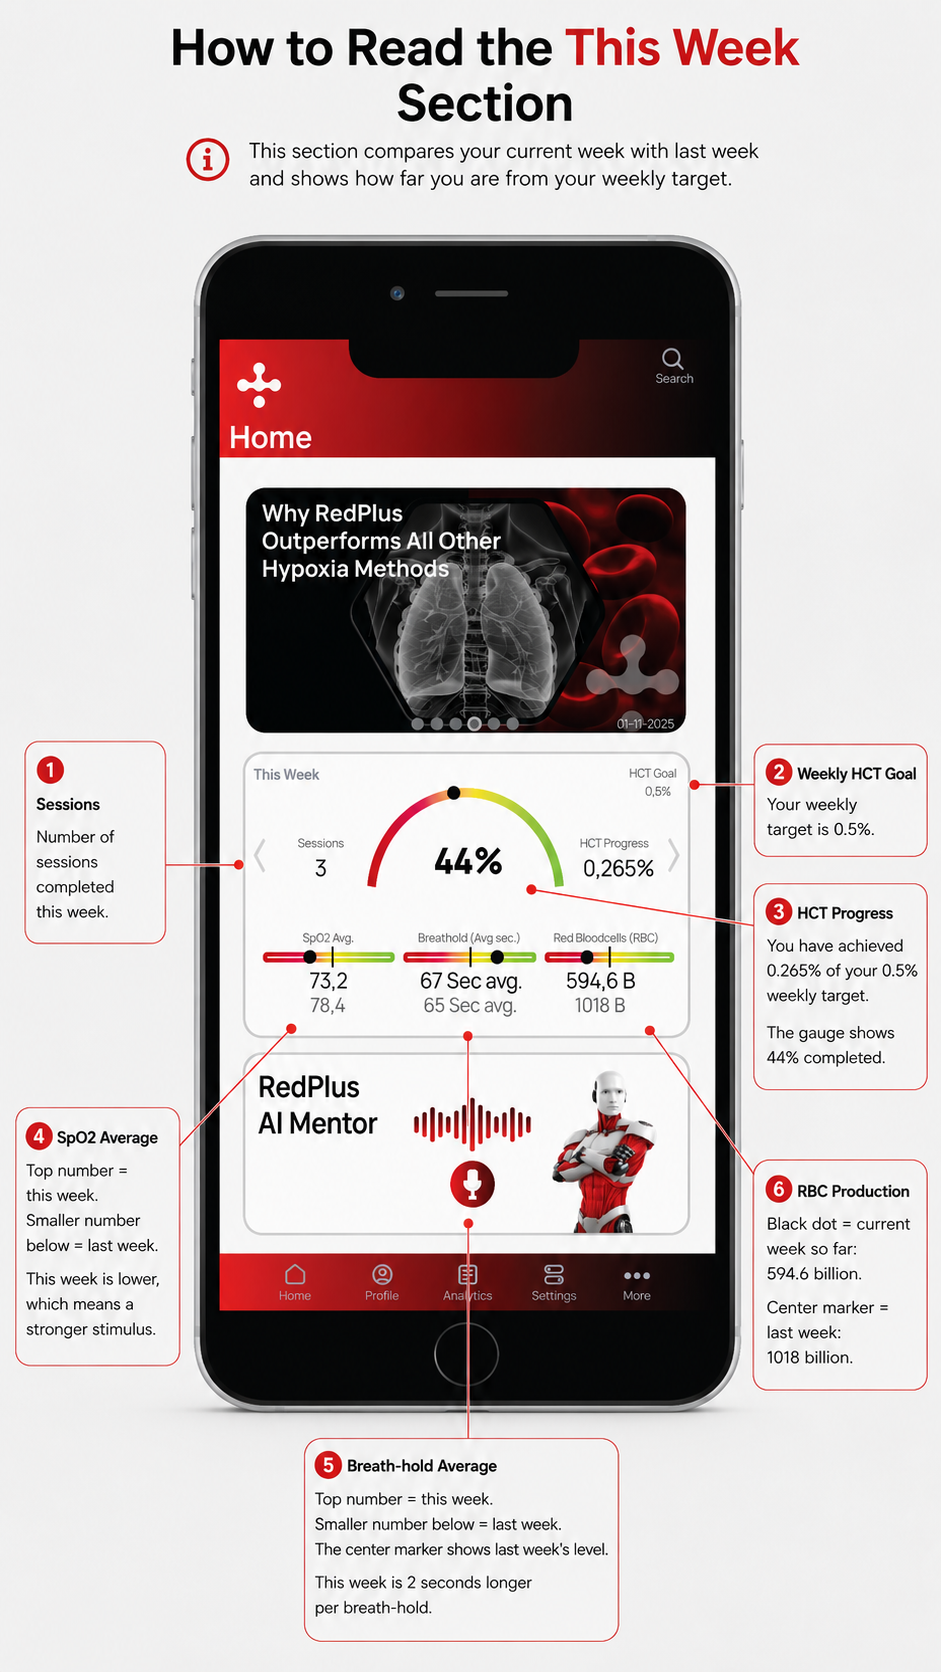
How to Read the “This Week” Section
1. Sessions
Number of sessions completed this week.
2. Weekly HCT Goal
Your weekly target is 0.5%.
3. HCT Progress
You have achieved 0.265% of your 0.5% weekly target.
The gauge shows 44% completed.
4. SpO₂ Average
Top number = this week.
Smaller number below = last week.
This week is lower, which means a stronger stimulus.
5. Breath-hold Average
Top number = this week.
Smaller number below = last week.
The center marker shows last week’s level.
This week is 2 seconds longer per breath-hold.
6. RBC Production
Black dot = current week so far: 594.6 billion.
Center marker = last week: 1018 billion.
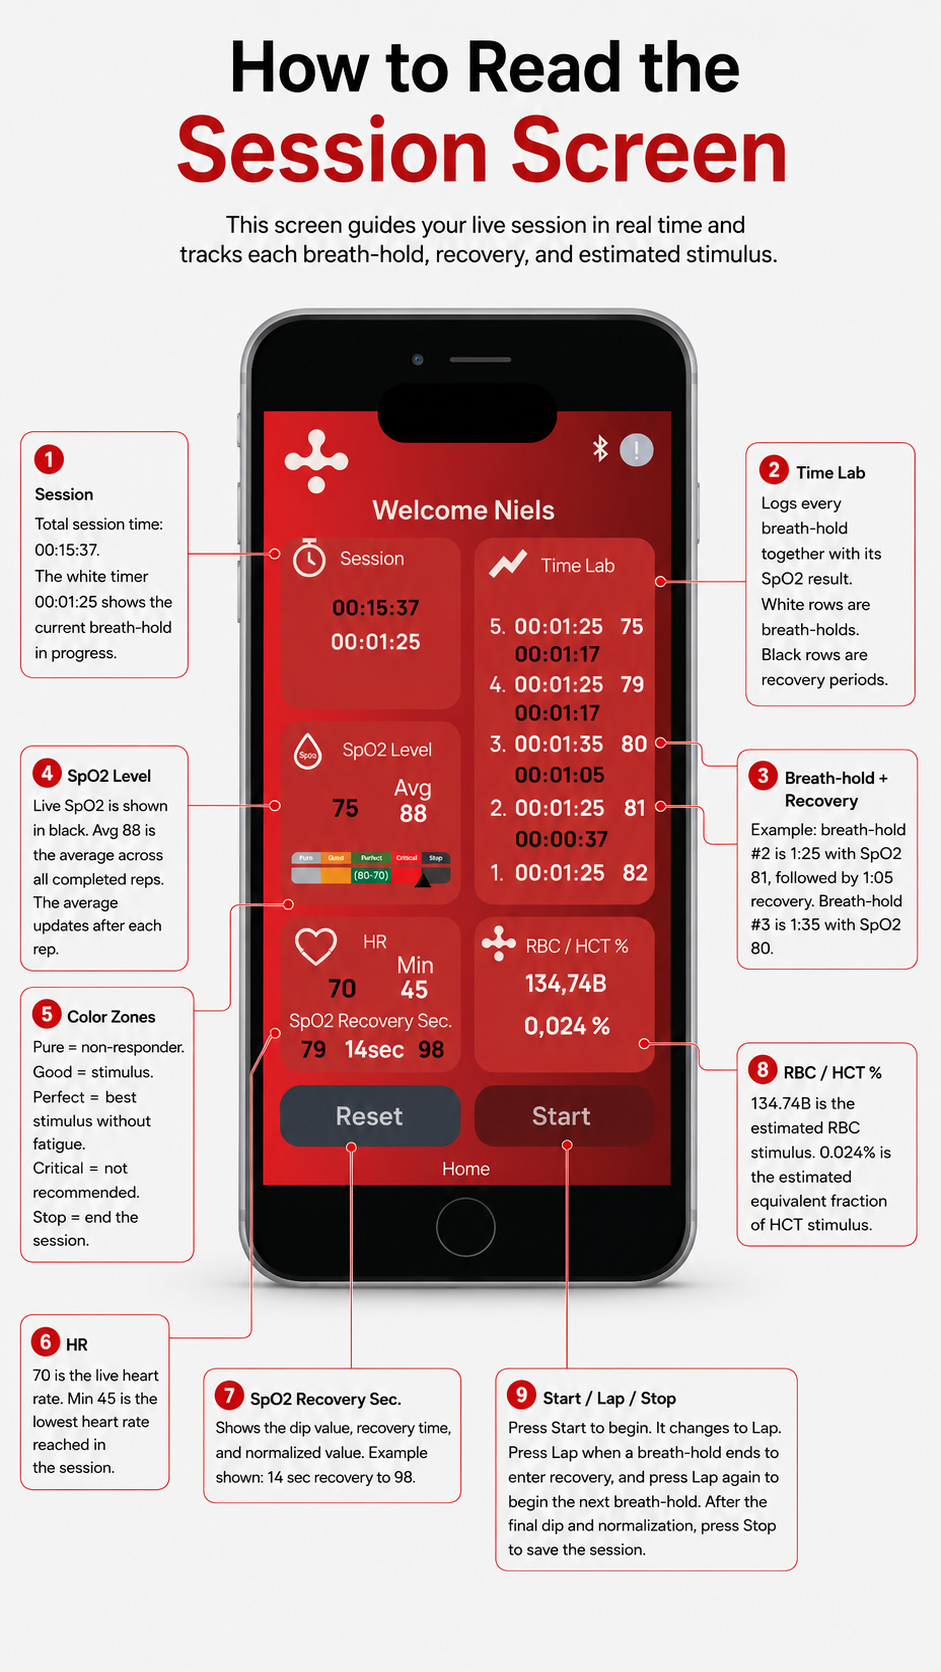
How to Read the Session Screen
1. Session
Total session time: 00:15:37.
The white timer 00:01:25 shows the current breath-hold in progress.
2. Time Lab
Logs every breath-hold together with its SpO₂ result.
White rows are breath-holds.
Black rows are recovery periods.
3. Breath-hold + Recovery
Example: breath-hold #2 is 1:25 with SpO₂ 81, followed by 1:05 recovery.
Breath-hold #3 is 1:35 with SpO₂ 80.
4. SpO₂ Level
Live SpO₂ is shown in black.
Avg 88 is the average across all completed reps.
The average updates after each rep.
5. Color Zones
Pure = non-responder.
Good = stimulus.
Perfect = best stimulus without fatigue.
Critical = not recommended.
Stop = end the session.
6. HR
70 is the live heart rate.
Min 45 is the lowest heart rate reached in the session.
7. SpO₂ Recovery Sec.
Shows the dip value, recovery time, and normalized value.
Example shown: 14 sec recovery to 98.
8. RBC / HCT %
134.74B is the estimated RBC stimulus.
0.024% is the estimated equivalent fraction of HCT stimulus.
9. Start / Lap / Stop
Press Start to begin. It changes to Lap.
Press Lap when a breath-hold ends to enter recovery, and press Lap again to begin the next breath-hold.
After the final SpO₂ dip and normalization, press Stop to save the session.