
Red Blood Cell Support
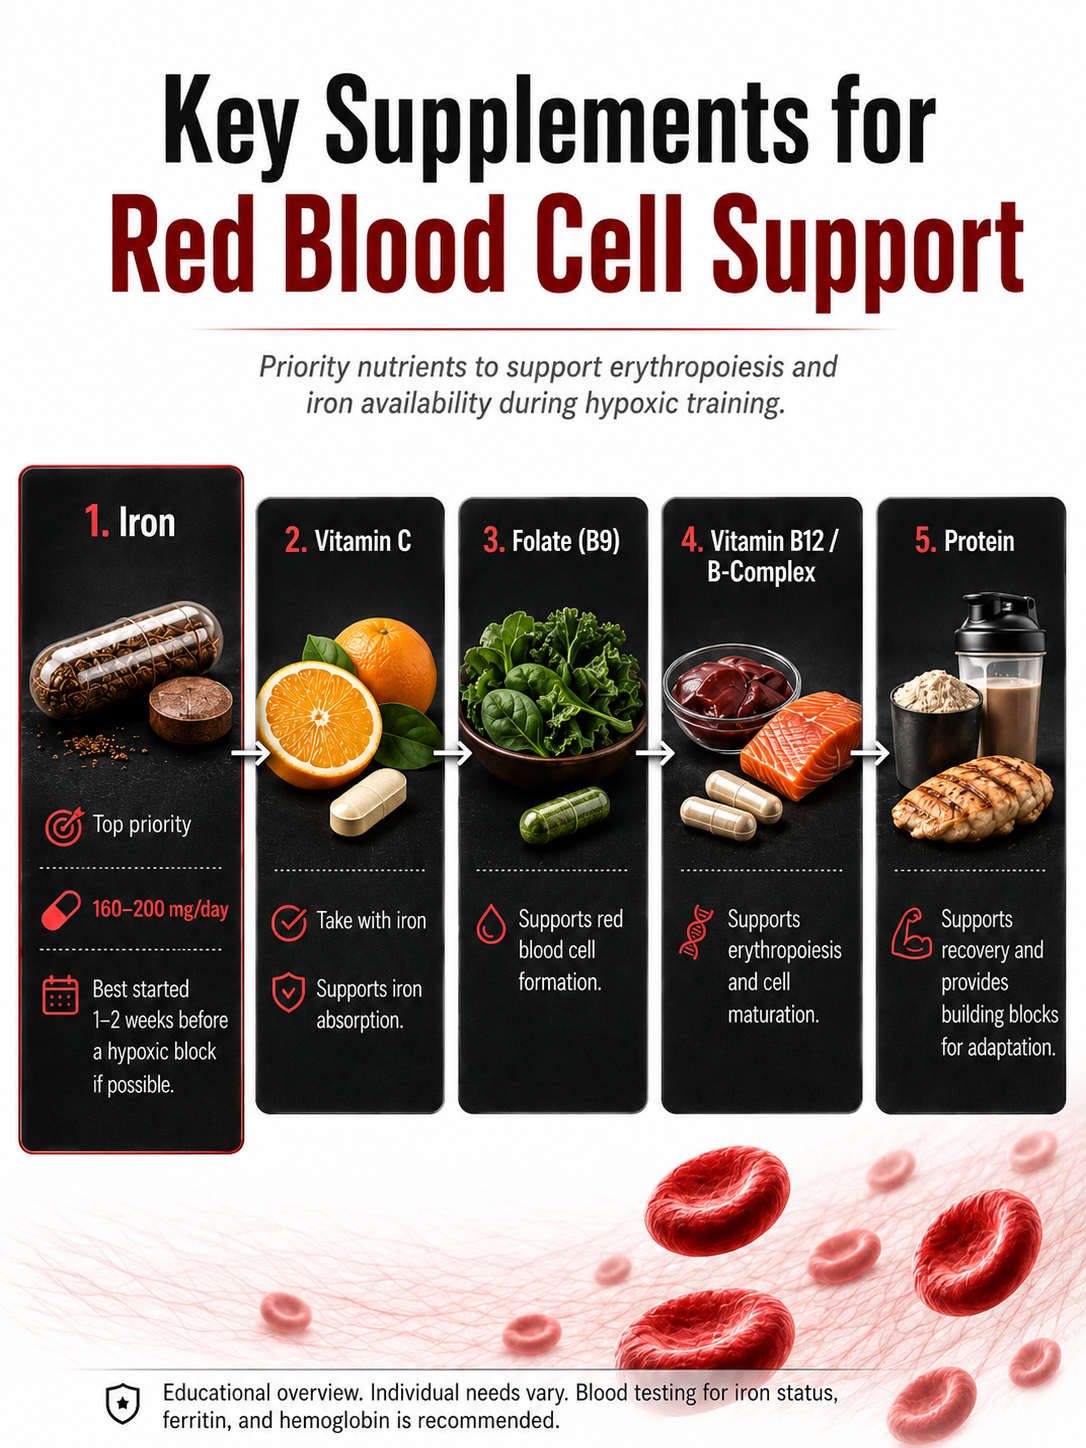
To support red blood cell production during hypoxic training, the body needs enough raw materials to build hemoglobin and new red blood cells efficiently. The most important nutritional priority is iron, supported by vitamin C, folate, vitamin B12 / B-complex, and adequate protein intake.
1. Iron
Iron is the top priority because it is essential for hemoglobin formation and oxygen transport. When hypoxic training increases the demand for red blood cell production, iron stores can be used up quickly.
A common support range during a hypoxic block is 160–200 mg per day, ideally started 1–2 weeks before the block if possible. If supplementation starts later, iron intake becomes even more important. Because iron needs vary, blood testing of ferritin, hemoglobin, and iron status is strongly recommended.
2. Vitamin C
Vitamin C helps improve iron absorption, which is why it is often taken together with iron. This is especially useful when iron intake is high and the goal is to make as much of it available as possible for red blood cell production.
3. Folate (Vitamin B9)
Folate is important for red blood cell formation because it supports DNA synthesis and cell division. In simple terms, folate helps the body produce new cells properly, including red blood cells.
4. Vitamin B12 / B-Complex
Vitamin B12 is essential for red blood cell maturation, and a broader B-complex can support the metabolic processes involved in erythropoiesis. Without enough B12, red blood cell production may be impaired even if iron intake is adequate.
5. Protein
Protein is also important because it provides the amino acids needed to build and repair body tissues and to support the overall adaptation process. While iron, folate, and B12 are more directly linked to red blood cell production, protein helps provide the structural and functional support the body needs during training and recovery.
Practical takeaway
If you want to support erythropoiesis during hypoxic training, start with iron as the main priority, combine it with vitamin C, and make sure you also have sufficient folate, B12 / B-complex, and protein.
For best results, supplementation should ideally be guided by blood tests and individual tolerance.