
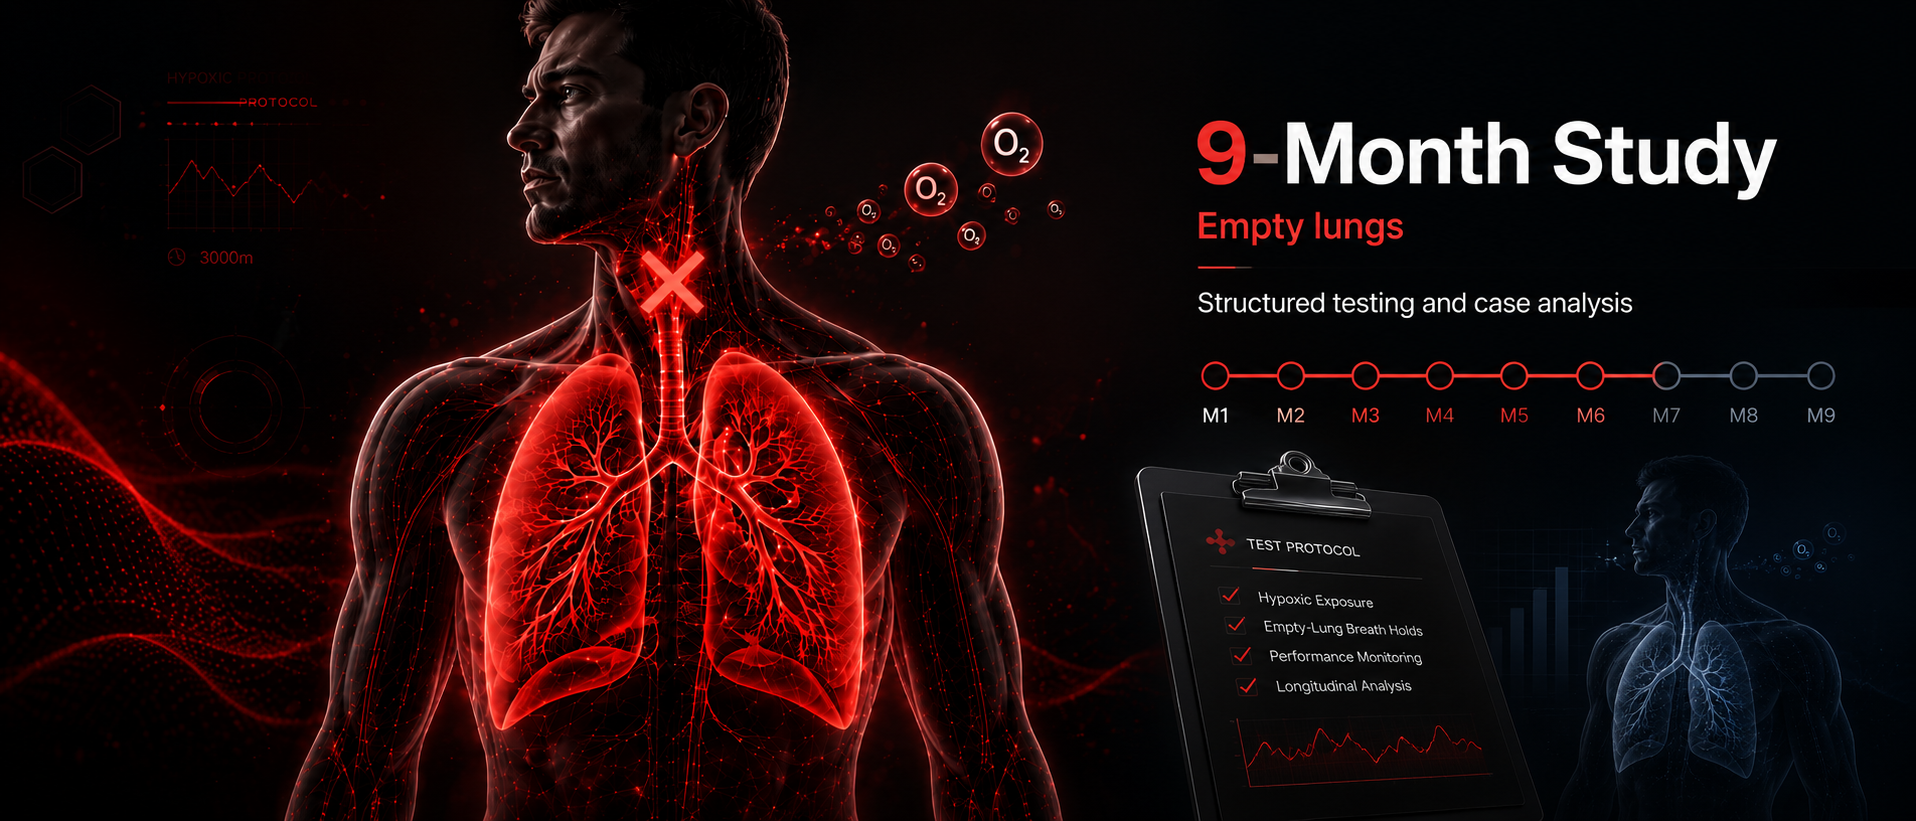
9-Month Study
Founder case: blood tests vs. hypoxic SpO₂ stimulus
Based on 3,316 breath-holds across 274 sessions, this appears to be the largest documented empty-lung breath-hold datasets in a performance context.
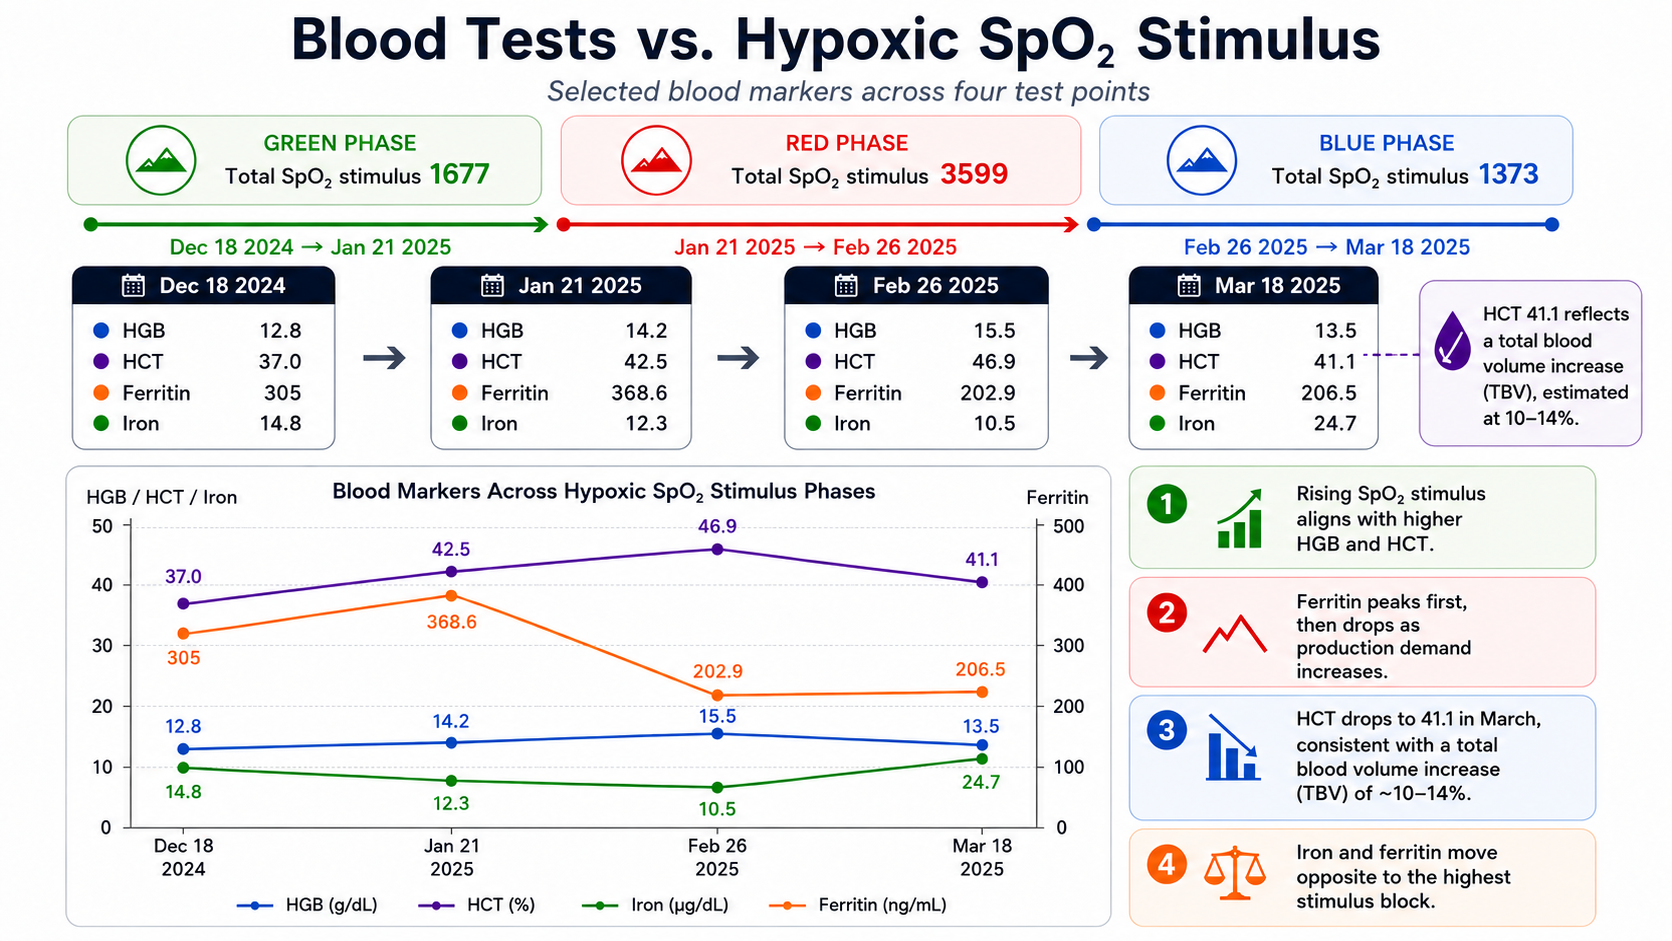
This founder case shows that the pattern is not based on a single marker, but on multiple blood markers moving together across the same hypoxic phases.
From the start of the protocol, iron falls progressively as hypoxic activity and repetition volume increase. That pattern is consistent with increased production demand during the highest stimulus block. After 26 February 2025, when total hypoxic stimulus and repetition count drop markedly, iron rises again. A likely explanation is that daily iron intake continues, while the immediate production demand is reduced.
Ferritin shows a similar picture. It rises initially from 305 to 368.6, but then drops sharply to 202.9 during the highest hypoxic phase — a decline of about 44.9% from the January peak. After stimulus is reduced, ferritin stabilises only slightly higher at 206.5, which supports the same interpretation: the strongest hypoxic block appears to coincide with the greatest production demand.
At the same time, hematocrit rises from 37.0 to 42.5 and then to 46.9 during the main build phase, before later falling to 41.1 in March. In the context of the other markers, that later drop is not interpreted here as a simple loss of effect, but as being consistent with a broader total blood volume expansion after the peak phase.
HGB follows the same overall direction and strengthens the picture further. Taken together, the combined movement in HGB, HCT, iron, ferritin, and hypoxic SpO₂ stimulus suggests a coherent hematological response rather than an isolated fluctuation in a single value.
In short, the remarkable part of this case is not one blood test alone, but that several markers move in a coordinated way across clearly different hypoxic stimulus periods.
Based on our review of the available literature, this appears to be one of the largest documented empty-lung breath-hold datasets in a performance context, comprising 3,316 breath-holds across 274 sessions over 9 months.
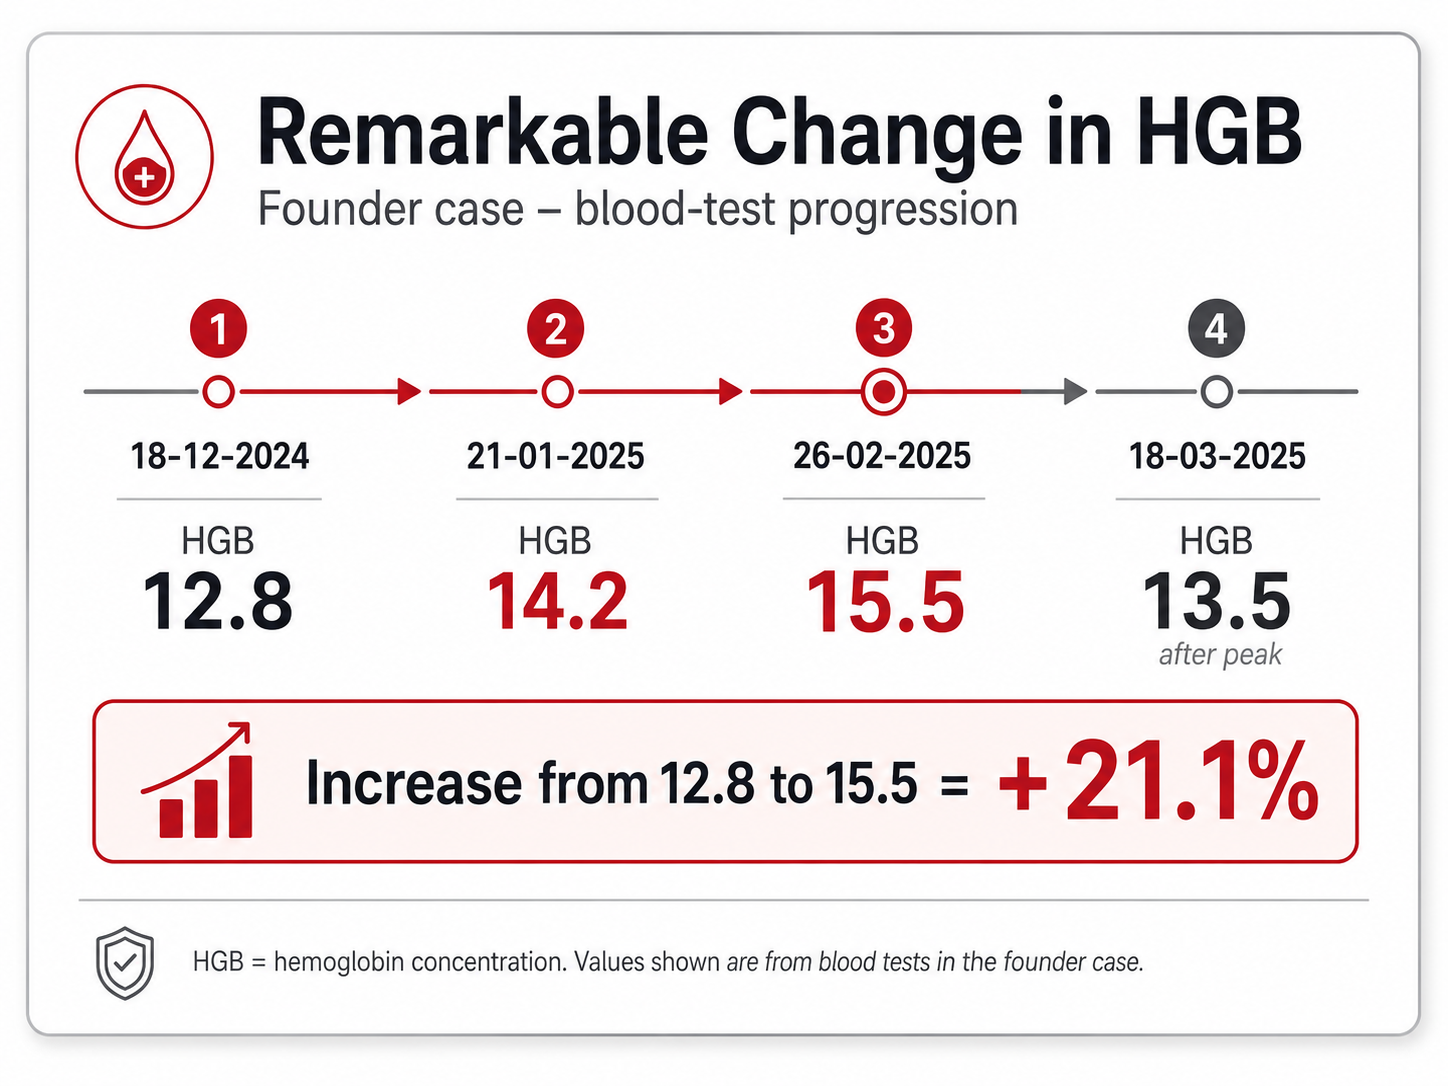
Why the HGB change matters
HGB rises from 12.8 on 18-12-2024 to 15.5 on 26-02-2025
— an increase of 21.1% during the high-stimulus phase.
That is a remarkable change on its own, but it becomes even more important because it does not stand alone. HGB rises together with hematocrit, while iron and ferritin move in the opposite direction during the strongest hypoxic block. This makes the HGB progression more meaningful as part of a broader hematological pattern.

Blood values, training load, and body weight during the test period
This slide adds important context to the founder case by showing that the blood-test pattern did not develop in isolation. It is presented alongside weekly training calories and body weight across the same period, so the blood values can be interpreted against actual training load and broader physiological stress.
The blood-test timeline shows a coordinated shift from December into late February. HGB rises from 12.8 to 14.2 and then to 15.5, while hematocrit rises from 37.0 to 42.5 and then to 46.9. At the same time, iron falls from 14.8 to 12.3 and then to 10.5, and ferritin drops sharply from its January peak of 368.6 to 202.9 by 26 February. This combination is important because it suggests that several markers move together during the highest hypoxic block, rather than one isolated blood value shifting on its own.
The training context supports that interpretation. Weekly training calories remain high through the January-to-March period, including several weeks above 10,000–12,000 kcal, with a major peak in March. In other words, the March blood-test picture does not occur during a low-load or recovery-only phase. That matters, because it makes a simple “loss of adaptation” explanation less convincing.
Body weight also trends downward across the same period, from about 81.7 kg in late January to around 76.0 kg around the March blood test. This reinforces that the body was undergoing a broader physiological shift during the testing window. The combination of high training load, falling body weight, falling iron availability, and changing ferritin strengthens the interpretation that the blood markers reflect a real adaptive process rather than random fluctuation.
The most important point is what happens after the late-February peak. By 18 March, measured hematocrit drops from 46.9 to 41.1, while HGB remains above the December baseline and training load stays high. In this context, the internal interpretation is that the March drop in measured HCT is more consistent with blood-volume expansion / dilution than with a simple collapse in oxygen-carrying adaptation. That is also why the slide ends with a working estimate of roughly 10–14% total blood-volume expansion.
Taken together, the picture is coherent: stronger hypoxic stimulus is followed by rising HGB and HCT, falling iron and ferritin during the highest demand phase, continued training load, reduced body weight, and then a later hematocrit drop that fits better with blood-volume expansion than with loss of effect. The slide therefore supports the broader founder-case conclusion that the physiological response should be read across multiple markers at the same time, not from HCT alone.
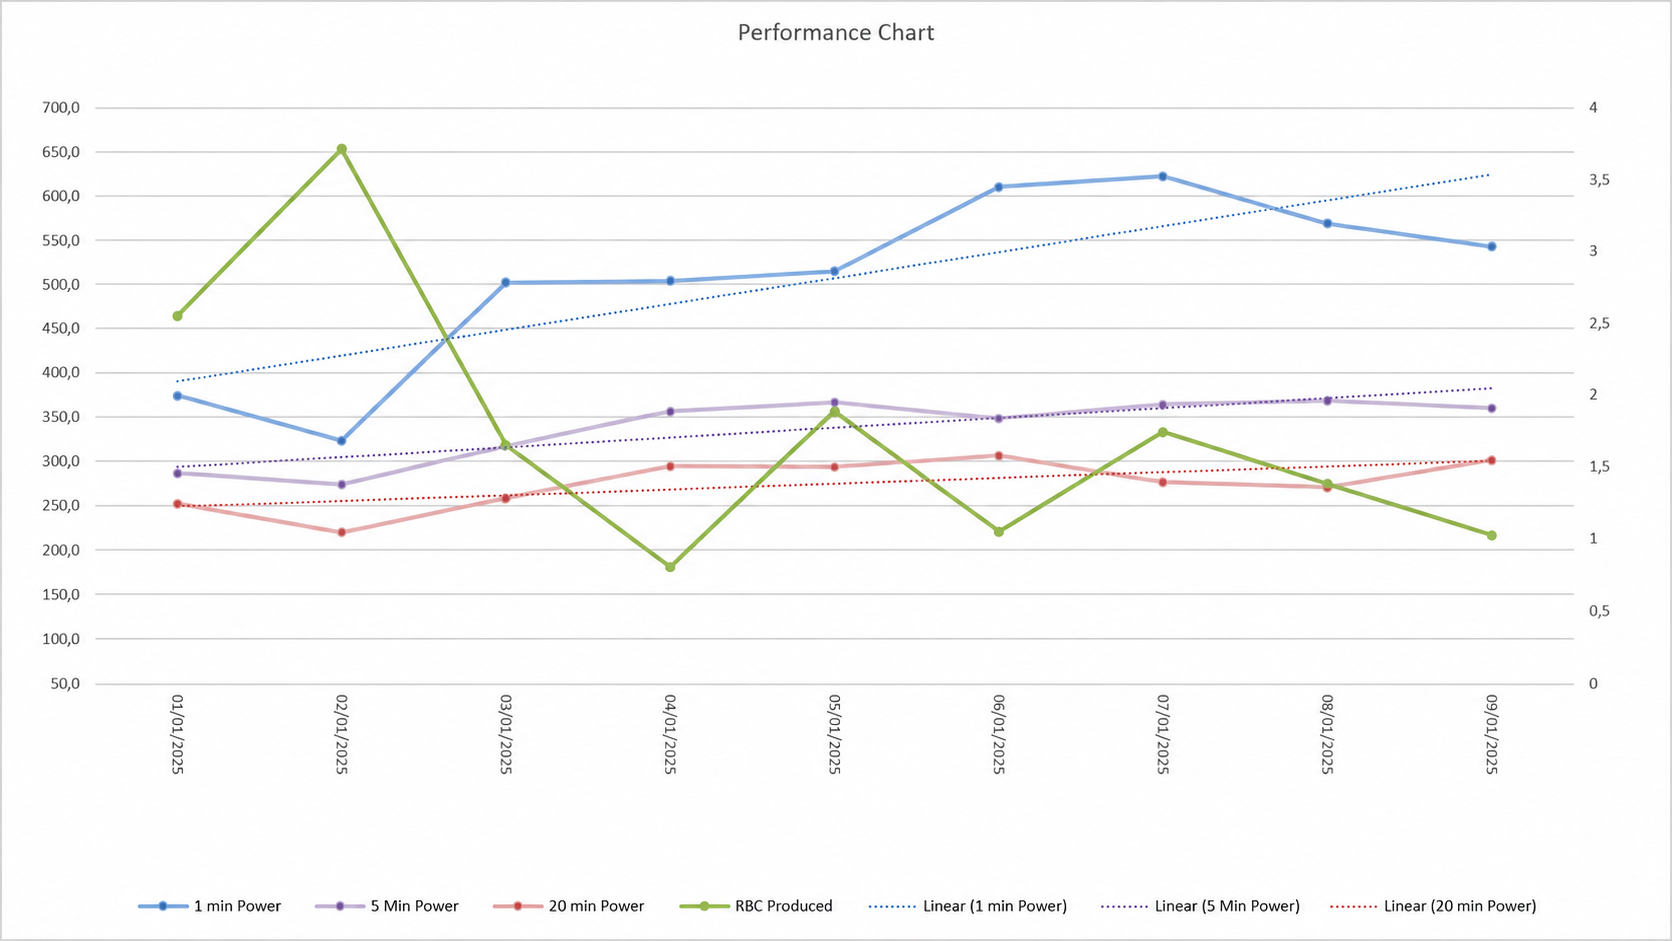
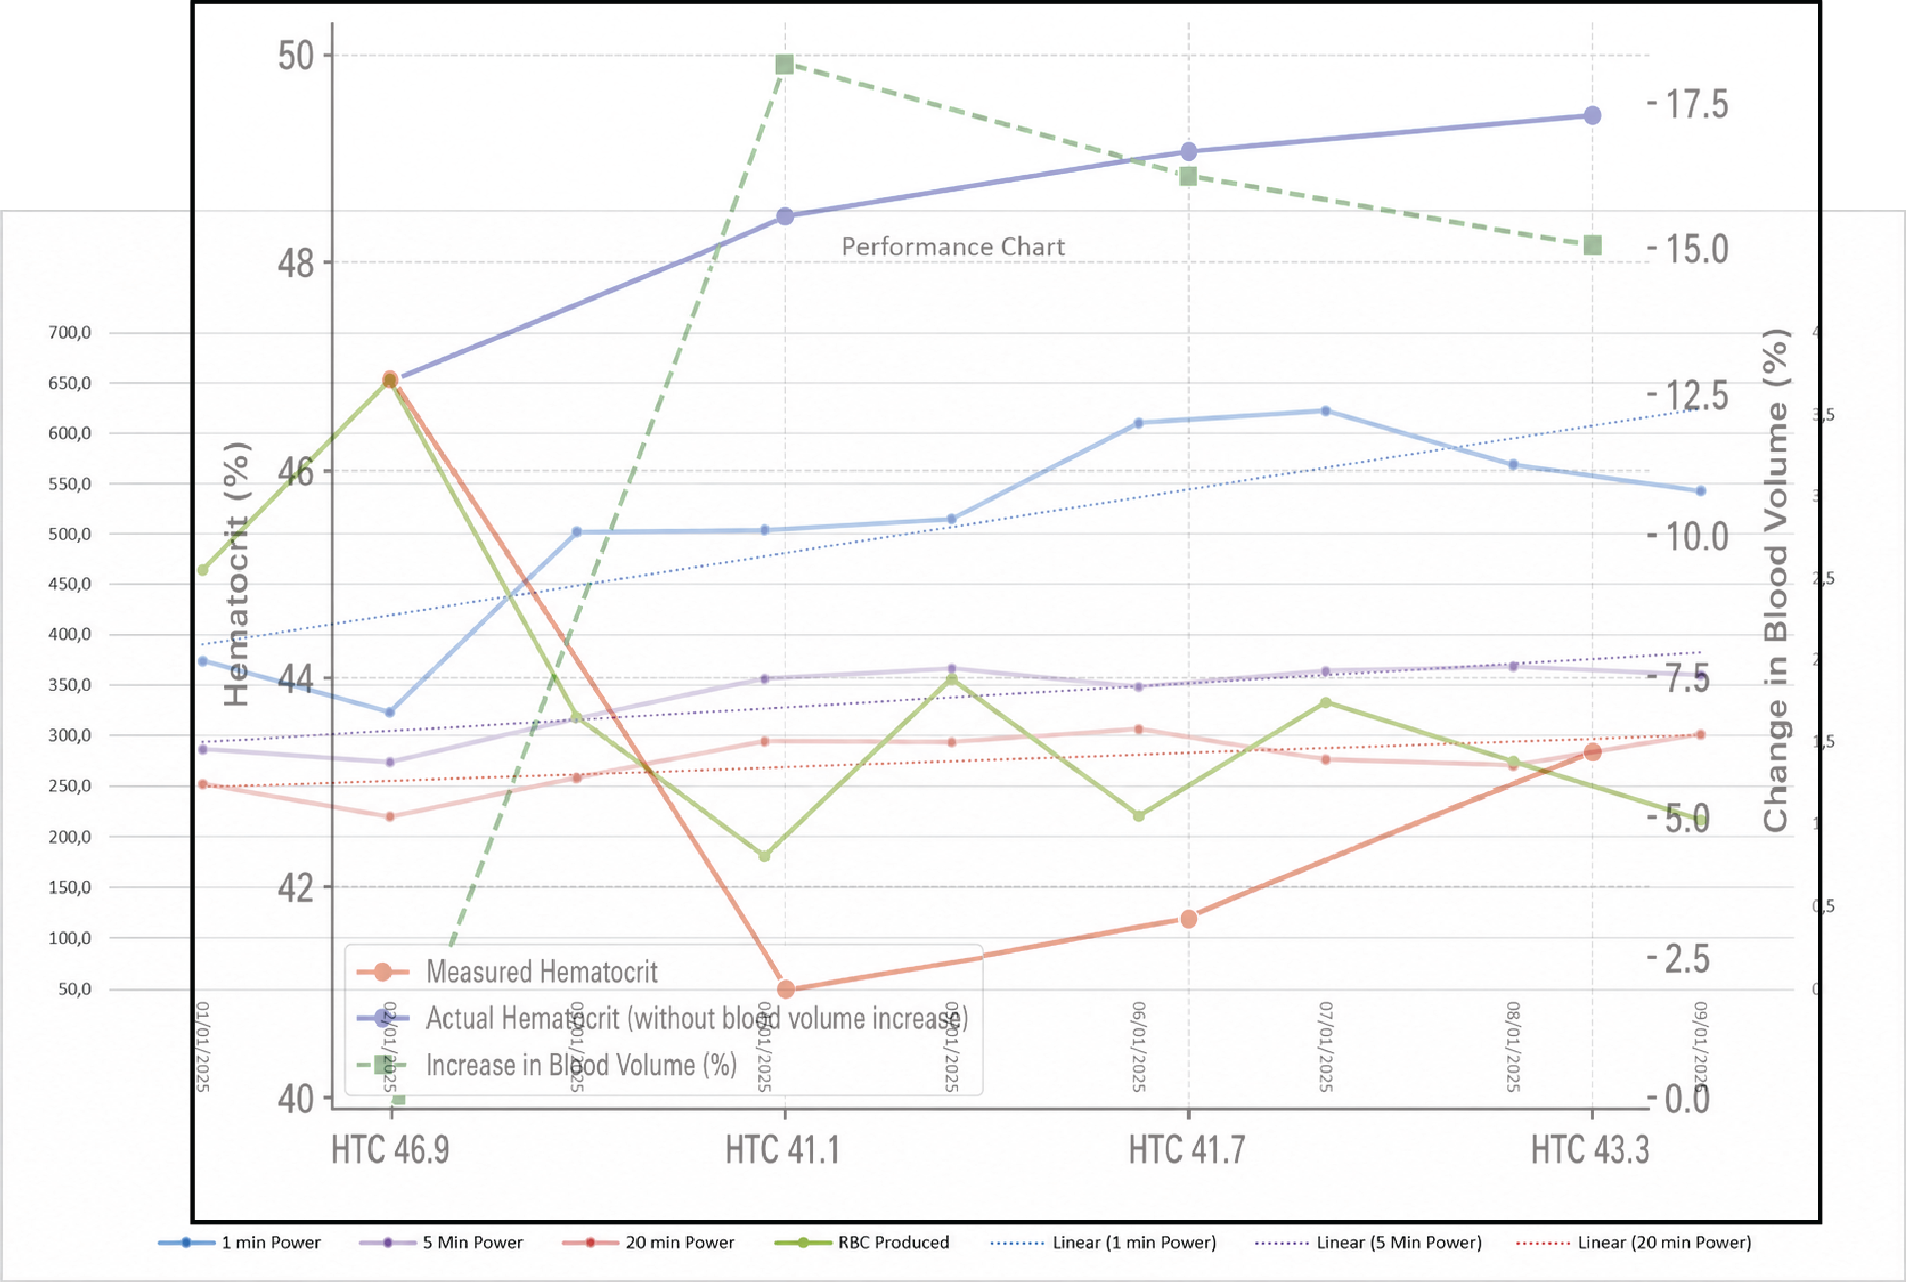
The key finding is not just the blood test — it is the performance response.
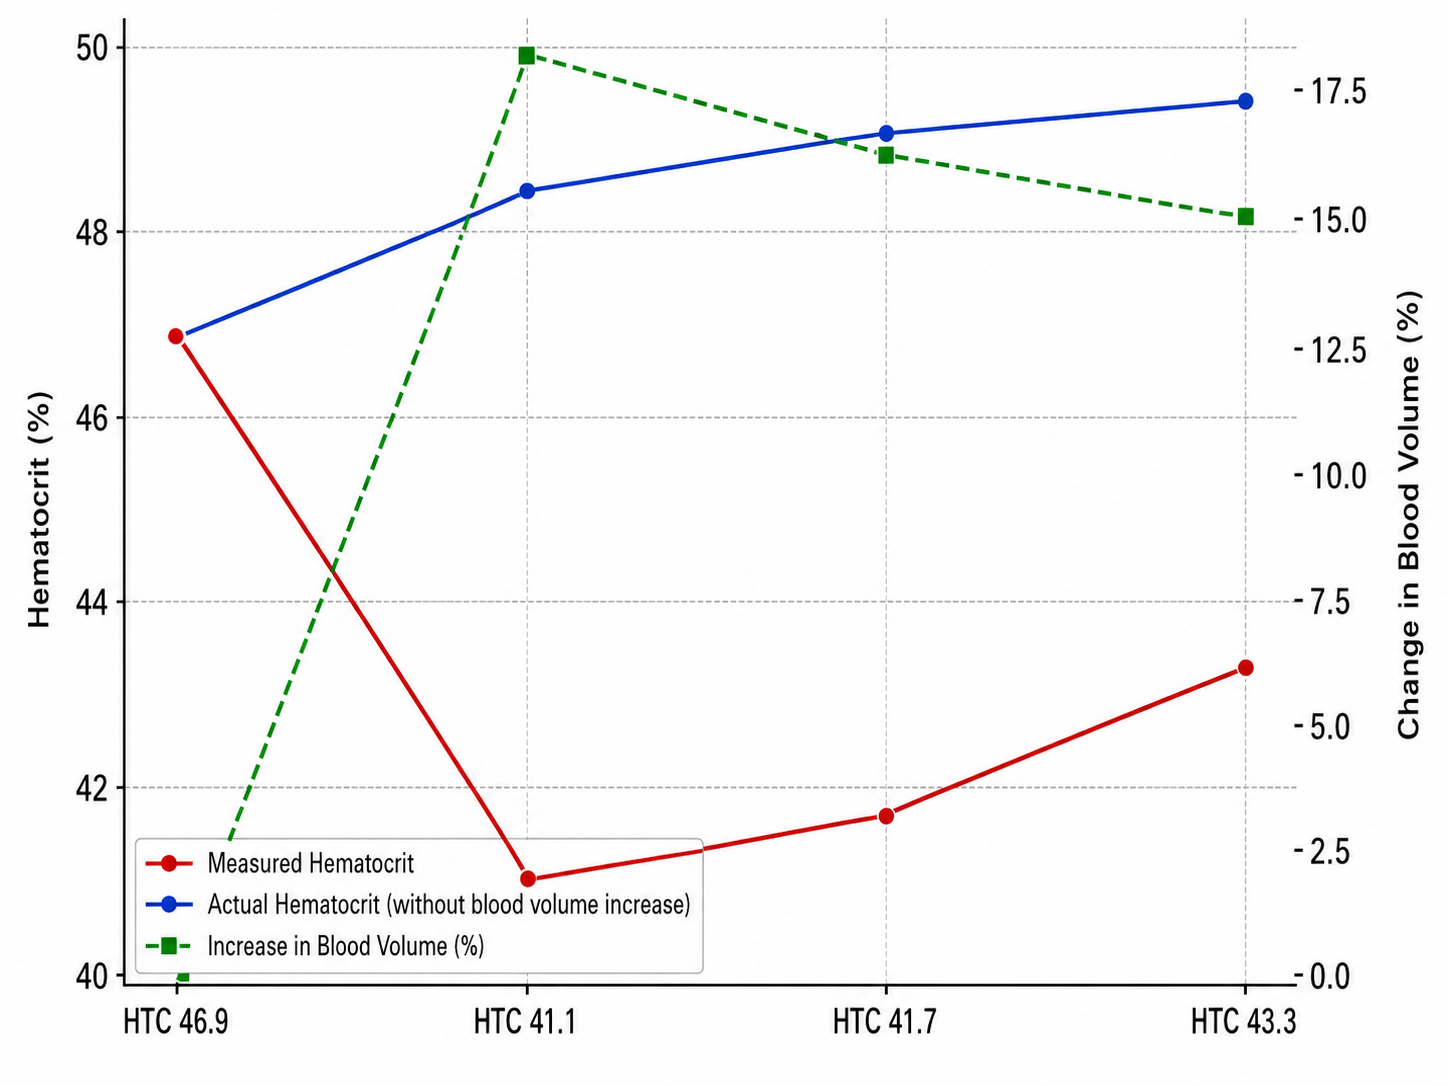
Even after measured HCT dropped from peak levels to 41.1%, performance improved across 1 min, 5 min and 20 min power. Combined with the blood volume model, this supports the conclusion that the apparent HCT drop reflects a total blood volume increase, while oxygen-transport capacity and performance continued to improve.
Measured HCT Down — Performance Up
After the hematocrit peak, measured HCT dropped to 41.1%. At the same time, the estimated RBC-production stimulus declined because RedPlus sessions were intentionally reduced from 3599 to 1373 after the main Peak phase.
Despite this reduction in new hypoxic stimulus, performance continued to improve across 1 min, 5 min and 20 min power.
This supports the interpretation that the HCT drop reflects a total blood volume increase, not a loss of adaptation. The pattern suggests that oxygen-transport capacity and performance remained elevated after the main stimulus phase.
The pattern is closer to an altitude-type adaptation than to classic heat training: a concentrated stimulus phase followed by a performance response that continues even after exposure is reduced.